This a continuation of the last blog entry. This time we are going to gather syslog messages from the monitoring containers and it is going to be deployed by ansible!
As usual, all this is based on Anton’s Karneliuk blog post. All credits to him.
So initially we built a monitoring stack with InfluxDB, Telegraf and Grafana manually to gather and visualise SNMP infor form the Arista cEOS switches.
This time, we are going to send SYSLOG from the monitoring stack containers to a new Telegraf instance.
Ideally, we would like to send Syslog from the cEOS devices but as Anton mentions, the syslog rfc3164 that most network kit implements, it is not supported (yet) by telegraf, that supports rfc5424.
You can read more info about this in all these links:
https://github.com/influxdata/telegraf/issues/4593
https://github.com/influxdata/go-syslog/pull/27
https://github.com/influxdata/telegraf/issues/7023
https://github.com/influxdata/telegraf/issues/4687
https://medium.com/@leodido/from-logs-to-metrics-f38854e3441a
https://itnext.io/metrics-from-kubernetes-logs-82cb1dcb3551
So the new ansible role for building influx-telegraf-grafana instances is “monitoring_stack”:
├── ansible.cfg
├── ansible-hosts
├── group_vars
│   ├── ceoslab.yaml
│   └── monitoring.yaml
└── playbooks
    ├── monitoring.yaml
    └── roles
        ├── monitoring_stack
        │   ├── tasks
        │   │   ├── container_grafana.yml
        │   │   ├── container_influxdb.yml
        │   │   ├── container_telegraf_snmp.yml
        │   │   ├── container_telegraf_syslog.yml
        │   │   └── main.yml
        │   └── templates
        │       ├── telegraf_snmp_template.j2
        │       └── telegraf_syslog_template.j2
We will have four monitoring containers:
- influxdb: our time-series database with two databases: snmp and syslog
- grafana: GUI to visualize influxdb contents, we will have pales for snmp and syslog queries. It will need to connect to influxdb
- telegraf-snmp: collector of snmp info from the cEOS containers. The list is introduced manually in the template. It will write in influxdb
- telegraf-syslog: collector of syslog messages from the monitoring containers. It will write in influxdb

As the containers are running locally, we define them in the inventory like this:
$ cat ansible-hosts
....
[monitoring]
localhost
We define some variables too in group_vars for the monitoring containers that will be used in the jinja2 templates and tasks
$ cat group_vars/monitoring.yaml
# Defaults for Docker containers
docker_mon_net:
  name: monitoring
  subnet: 172.18.0.0/16
  gateway: 172.18.0.1

path_to_containers: /PICK_YOUR_PATH/monitoring-example

var_influxdb:
  username: xxx
  password: xxx123
  snmp_community: xxx123
  db_name:
    snmp: snmp
    syslog: syslog

var_grafana:
  username: admin
  password: xxx123

var_telegraf:
…
So we execute the playbook like this:
ansible master$ ansible-playbook playbooks/monitoring.yaml -vvv --ask-become-pass
The very first time, if you pay attention to the ansible logging, everything should success. If for any reason you have to make changes or troubleshoot, and execute again the full playbook, some tasks will fail, but not the playbook (this is done with ignore_errors: yes inside a task). For example, the docker network creation will fail as it is already there. The same if you try to create the user and dbs in a already running influx instance.
That playbook just calls the role “monitoring_stack“. The main playbook in that role will create the docker network where all containers will be attached, all the containers and do something hacky with iptables.
As the cEOS lab is built (using docker-topo) independently of this playbook, there are already some iptables rules in place, and somehow, when executing the role, the rules change and it blocks the new network for any outbound connectivity.
Before the iptables change in the playbook:
# iptables -t filter -S DOCKER-ISOLATION-STAGE-1
Warning: iptables-legacy tables present, use iptables-legacy to see them
-N DOCKER-ISOLATION-STAGE-1
-A DOCKER-ISOLATION-STAGE-1 -i br-4bd17cfa19a8 ! -o br-4bd17cfa19a8 -j DOCKER-ISOLATION-STAGE-2
-A DOCKER-ISOLATION-STAGE-1 -j ACCEPT
-A DOCKER-ISOLATION-STAGE-1 -i br-94c1e813ad6f ! -o br-94c1e813ad6f -j DOCKER-ISOLATION-STAGE-2
-A DOCKER-ISOLATION-STAGE-1 -i br-13ab2b6a0d1d ! -o br-13ab2b6a0d1d -j DOCKER-ISOLATION-STAGE-2
-A DOCKER-ISOLATION-STAGE-1 -i br-00db5844bbb0 ! -o br-00db5844bbb0 -j DOCKER-ISOLATION-STAGE-2
-A DOCKER-ISOLATION-STAGE-1 -i br-121978ca0282 ! -o br-121978ca0282 -j DOCKER-ISOLATION-STAGE-2
-A DOCKER-ISOLATION-STAGE-1 -i docker0 ! -o docker0 -j DOCKER-ISOLATION-STAGE-2
-A DOCKER-ISOLATION-STAGE-1 -j RETURN
#
# iptables -t filter -S DOCKER-ISOLATION-STAGE-2
Warning: iptables-legacy tables present, use iptables-legacy to see them
-N DOCKER-ISOLATION-STAGE-2
-A DOCKER-ISOLATION-STAGE-2 -o br-4bd17cfa19a8 -j DROP
-A DOCKER-ISOLATION-STAGE-2 -o br-94c1e813ad6f -j DROP
-A DOCKER-ISOLATION-STAGE-2 -o br-13ab2b6a0d1d -j DROP
-A DOCKER-ISOLATION-STAGE-2 -o br-00db5844bbb0 -j DROP
-A DOCKER-ISOLATION-STAGE-2 -o br-121978ca0282 -j DROP
-A DOCKER-ISOLATION-STAGE-2 -o docker0 -j DROP
-A DOCKER-ISOLATION-STAGE-2 -j RETURN
I want to avoid DOCKER-ISOLATION-STAGE-2 so I want the “-A DOCKER-ISOLATION-STAGE-1 -j ACCEPT” on top of that chain.
This is not the first (neither last) time that this issue bites me. I need to review carefully the docker-topo file and really get me head around the networking expectations from docker.
Another thing about docker networking that bites me very often. In my head, each monitoring has an IP. For example influxdb is 172.18.0.2 and telegraf-syslog is 172.18.0.4. We have configured influxdb to send syslog to telegraf-syslog container so I would expect the influxdb container to use its 0.2 and everything is local (no forwarding, no firewall, etc0. But not, it uses the host ip, 172.18.0.1.
Apart from that, there are several things that I had to review while adapting the role to my environment regarding docker and ansible.
docker documentation:
how to create network: https://docs.docker.com/engine/reference/commandline/network_create/
how to configure container logs: https://docs.docker.com/engine/reference/commandline/container_logs/
how to configure the logging driver in a container: https://docs.docker.com/config/containers/logging/configure/
how to configure syslog in a container: https://docs.docker.com/config/containers/logging/syslog/
how to run commands from a running container: https://docs.docker.com/engine/reference/commandline/exec/
ansible documentation:
become – run comamnds with sudo in a playbook: https://docs.ansible.com/ansible/latest/user_guide/become.html (–ask-become-pass, -K)
docker container module: https://docs.ansible.com/ansible/latest/modules/docker_container_module.html
grafana data source module: https://docs.ansible.com/ansible/latest/modules/grafana_datasource_module.html
This is important because via ansible, I had to workout the meaning of become, how to add the syslog config in the containers and add grafana datasources via a module.
All my ansible code is here.
Another thing I had to hardcode in the code, it is the IP for the telegraf-syslog container in each container playbook:
syslog-address: “udp://172.18.0.4:6514”
$ cat container_influxdb.yml
---
...
- name: 4- CONTAINER INFLUXDB // LAUNCHING CONTAINER
  docker_container:
      name: influxdb
      image: influxdb
      state: started
      command: "-config /etc/influxdb/influxdb.conf"
      networks:
          - name: "{{ docker_mon_net.name }}"
      purge_networks: yes
      ports:
          - "8086:8086"
      volumes:
          - "{{ path_to_containers }}/influxdb/influxdb.conf:/etc/influxdb/influxdb.conf:ro"
          - "{{ path_to_containers }}/influxdb/data:/var/lib/influxdb"
      log_driver: syslog
      log_options:
        syslog-address: "udp://172.18.0.4:6514"
        tag: influxdb
        syslog-format: rfc5424
  become: yes
  tags:
      - tag_influx
...
Once you have all containers running:
$ docker ps -a
CONTAINER ID        IMAGE               COMMAND                  CREATED             STATUS              PORTS                                                  NAMES
dd519ff01d6e        telegraf            "/entrypoint.sh -con…"   4 hours ago         Up 4 hours          8092/udp, 0.0.0.0:161->161/udp, 8125/udp, 8094/tcp     telegraf_snmp
869f158046a6        grafana/grafana     "/run.sh"                4 hours ago         Up 4 hours          0.0.0.0:3000->3000/tcp                                 grafana
dc68f261746b        influxdb            "/entrypoint.sh -con…"   4 hours ago         Up 4 hours          0.0.0.0:8086->8086/tcp                                 influxdb
3662c3c69b21        telegraf            "/entrypoint.sh -con…"   6 hours ago         Up 6 hours          8092/udp, 0.0.0.0:6514->6514/udp, 8125/udp, 8094/tcp   telegraf_syslog
ada1f884f1b7        ceos-lab:4.23.3M    "/sbin/init systemd.…"   28 hours ago        Up 4 hours          0.0.0.0:2002->22/tcp, 0.0.0.0:9002->443/tcp            3node_r03
22d9c4ae9043        ceos-lab:4.23.3M    "/sbin/init systemd.…"   28 hours ago        Up 4 hours          0.0.0.0:2001->22/tcp, 0.0.0.0:9001->443/tcp            3node_r02
fe7046b1f425        ceos-lab:4.23.3M    "/sbin/init systemd.…"   28 hours ago        Up 4 hours          0.0.0.0:2000->22/tcp, 0.0.0.0:9000->443/tcp            3node_r01
You should verify that syslog messages are stored in influxdb:
$ curl -G 'https://localhost:8086/query?db=syslog&pretty=true&u=xxx&p=xxx123' --data-urlencode "q=SELECT * FROM syslog limit 2" --insecure
{
    "results": [
        {
            "statement_id": 0,
            "series": [
                {
                    "name": "syslog",
                    "columns": [
                        "time",
                        "appname",
                        "facility",
                        "facility_code",
                        "host",
                        "hostname",
                        "message",
                        "msgid",
                        "procid",
                        "severity",
                        "severity_code",
                        "timestamp",
                        "version"
                    ],
                    "values": [
                        [
                            "2020-07-21T12:08:16.216632823Z",
                            "influxdb",
                            "daemon",
                            3,
                            "3662c3c69b21",
                            "athens",
                            "ts=2020-07-21T12:08:16.169711Z lvl=info msg=\"InfluxDB starting\" log_id=0O8KE_AG000 version=1.8.1 branch=1.8 commit=af0237819ab9c5997c1c0144862dc762b9d8fc25",
                            "influxdb",
                            "11254",
                            "err",
                            3,
                            1595333296000000000,
                            1
                        ],
We can create the new queries in grafana for SYSLOG. The datasources are already created by ansible so we dont have to worry about that.
For creating a query about the number of syslog messages we receive. This is what I did:
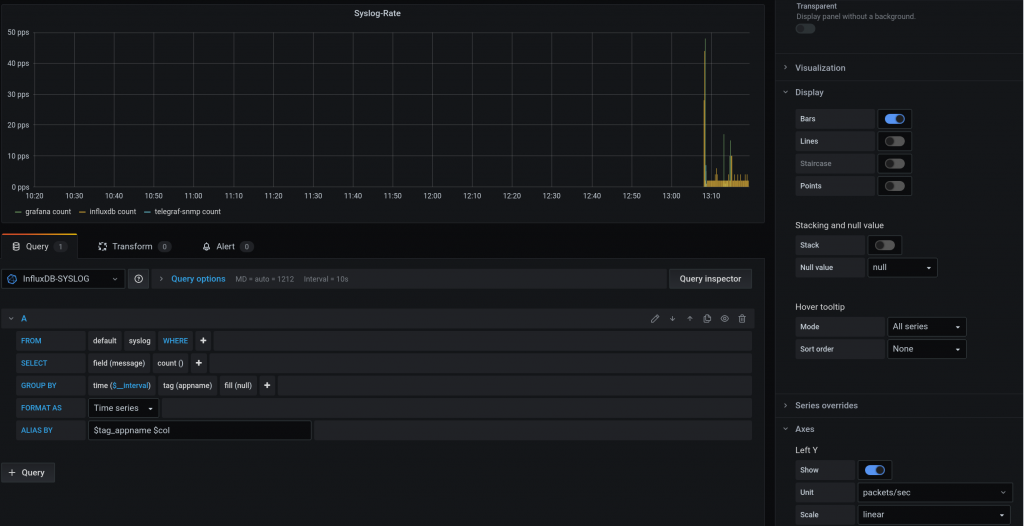
Most of the entries come from “influxdb”.
For creating a query with the content of each syslog message:
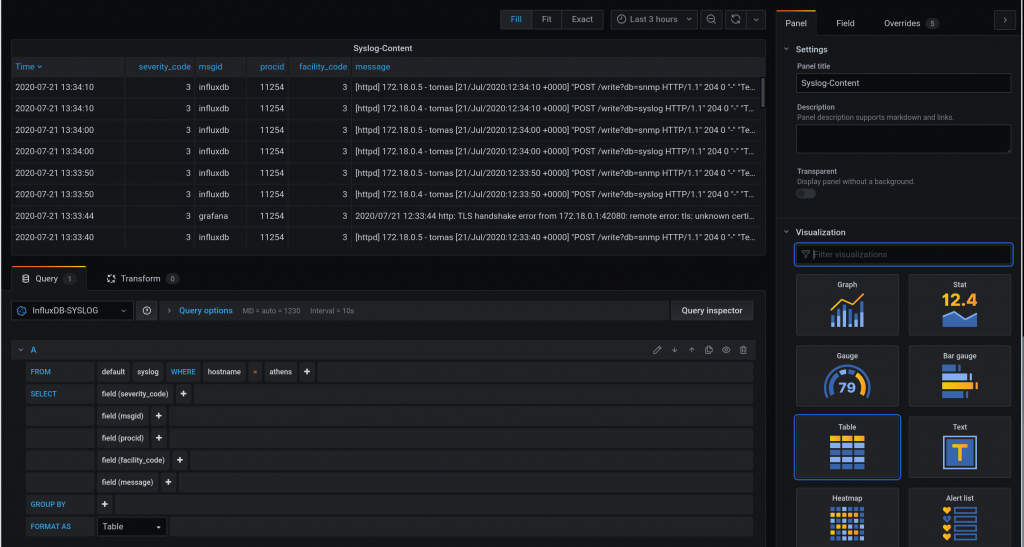
Here I struggled a bit. I can’t really change much in the table view.
And this is the dashboard with the syslog queries and snmp from the last blog entry:
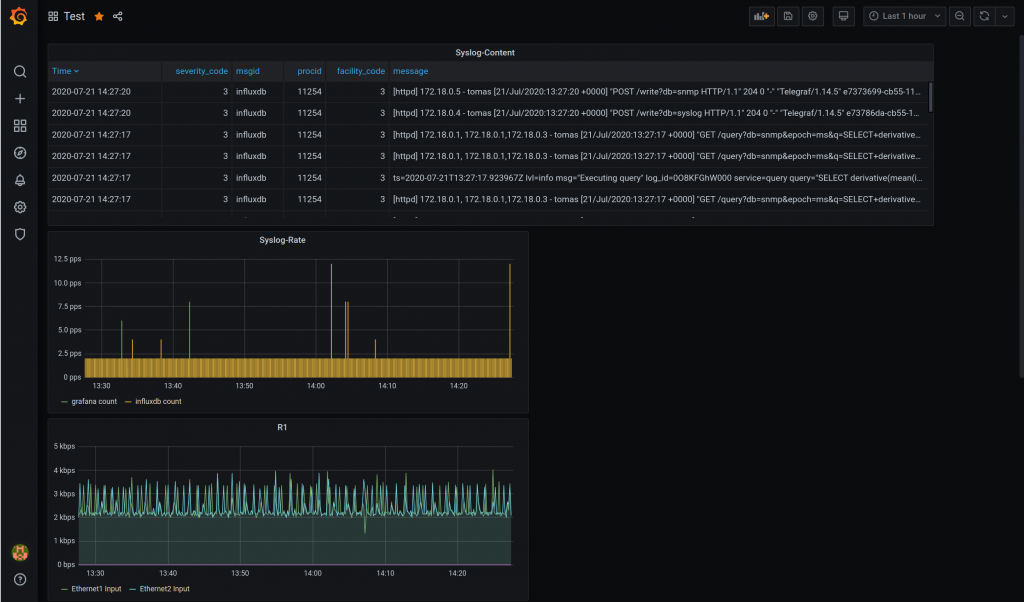
So at the end, I have an ansible role working!
Need to learn more about how to backup stuff from grafana. I have been playing with this:
https://github.com/ysde/grafana-backup-tool
Next thing I want to try is telemetry.