Summary 2025 OCP by Sharada: Power moving from AC to DC, liquid cooling is a must, NVIDIA netwoking in DCI with Spectrum-XGS (although I dont really see the details)
Global Scale-Computing: This is a new paradigm from current Hyperscalers design, they have the global scale but at the end of the day the compute is not just a global unit.
DOAC McConaughey: It was like when I read his book. It is so appealing, raw, real: Resistance + Innate ability + Endurance
Almeyda: Confundes disfruta con ganar dinero / Dejar el dinero e ir a trabajar al campo con vacas y caballos.
DOAC + 1st Dr K: Very interesting anecdote, I remember that video and it was actually great. And I read DOAC book, and I was surprised that he actually uses the guidelines of the book: sweat the small stuff (long-term game), the last impression matters (peak-end rule), CO2 levels
I think these are the 3 interviews so far from Dr K in DOAC: 1st, 2nd, 3rd
DOAC + Vinh Giang: FORD: Family, Occupation, Recreation, Dreams — I think I can remember this word for the day I have a conversation….
15: Dont listen to people who haven’t done the thing
14: If you dont know anybody, you need to become the person they want to know. You get a network, when you provide value. Build your own brand
13: Wealthy people get their money to work
12: stay small enough, long enough, you will be big enough, soon enough: keep the expenses low
11: Play 10y game – compound is a edge.
10: Master sales and marketing. Be everywhere, everytime.
9: Happy but not content: If you become comfortable in the top, the underdog will eat you.
8: Hire smart people and know your are not that smart.
7: Find a way to make money while you are sleep, if not your work until you die (close to 13) Money made with your brain, will outlast the money made with your back.
6: CEO = Change equals Opportunity
5: Marketing: everybody needs you, but they dont know who you are
4: Procrastination is the assesination of all destinations. What you can do today, dont do it tomorrow. Action takers.
3: Think bigger, same stress about 1000$ problem as the 100m$ problem, but at 100m$ bar, you have less competition.
2: Believe on your self: Does the bird on a branch, trust the branch or its wings?
1: Thanks God, I’ve got today. Tomorrow is not guaranteed. Live like you are dreaming
I was already playing with gNMI and protobuf a couple of months ago. But this week I received a summary from the last NANOG80 meeting and there was a presentation about it. Great job from Colin!
So I decided to give it a go as the demo was based on docker and I have already my Arista lab in cEOS and vEOS as targets.
Ok, the container is created and seems running but the gnmi-gateway can’t connect to my cEOS r01….
First thing, I had to check iptables. It is not the first time that when playing with docker and building different environments (vEOS vs gnmi-gateway) with different docker commands, iptables may be not configured properly.
And it was the case again:
# iptables -t filter -S DOCKER-ISOLATION-STAGE-1
Warning: iptables-legacy tables present, use iptables-legacy to see them
-N DOCKER-ISOLATION-STAGE-1
-A DOCKER-ISOLATION-STAGE-1 -i br-43481af25965 ! -o br-43481af25965 -j DOCKER-ISOLATION-STAGE-2
-A DOCKER-ISOLATION-STAGE-1 -j ACCEPT
-A DOCKER-ISOLATION-STAGE-1 -i docker0 ! -o docker0 -j DOCKER-ISOLATION-STAGE-2
-A DOCKER-ISOLATION-STAGE-1 -i br-94c1e813ad6f ! -o br-94c1e813ad6f -j DOCKER-ISOLATION-STAGE-2
-A DOCKER-ISOLATION-STAGE-1 -i br-4bd17cfa19a8 ! -o br-4bd17cfa19a8 -j DOCKER-ISOLATION-STAGE-2
-A DOCKER-ISOLATION-STAGE-1 -i br-13ab2b6a0d1d ! -o br-13ab2b6a0d1d -j DOCKER-ISOLATION-STAGE-2
-A DOCKER-ISOLATION-STAGE-1 -i br-121978ca0282 ! -o br-121978ca0282 -j DOCKER-ISOLATION-STAGE-2
-A DOCKER-ISOLATION-STAGE-1 -i br-00db5844bbb0 ! -o br-00db5844bbb0 -j DOCKER-ISOLATION-STAGE-2
-A DOCKER-ISOLATION-STAGE-1 -j RETURN
So I moved the new docker bridge network for gnmi-gateway after “ACCEPT” and solved.
# iptables -t filter -D DOCKER-ISOLATION-STAGE-1 -j ACCEPT
# iptables -t filter -I DOCKER-ISOLATION-STAGE-1 -j ACCEPT
#
# iptables -t filter -S DOCKER-ISOLATION-STAGE-1
Warning: iptables-legacy tables present, use iptables-legacy to see them
-N DOCKER-ISOLATION-STAGE-1
-A DOCKER-ISOLATION-STAGE-1 -j ACCEPT
-A DOCKER-ISOLATION-STAGE-1 -i br-43481af25965 ! -o br-43481af25965 -j DOCKER-ISOLATION-STAGE-2
-A DOCKER-ISOLATION-STAGE-1 -i docker0 ! -o docker0 -j DOCKER-ISOLATION-STAGE-2
-A DOCKER-ISOLATION-STAGE-1 -i br-94c1e813ad6f ! -o br-94c1e813ad6f -j DOCKER-ISOLATION-STAGE-2
-A DOCKER-ISOLATION-STAGE-1 -i br-4bd17cfa19a8 ! -o br-4bd17cfa19a8 -j DOCKER-ISOLATION-STAGE-2
-A DOCKER-ISOLATION-STAGE-1 -i br-13ab2b6a0d1d ! -o br-13ab2b6a0d1d -j DOCKER-ISOLATION-STAGE-2
-A DOCKER-ISOLATION-STAGE-1 -i br-121978ca0282 ! -o br-121978ca0282 -j DOCKER-ISOLATION-STAGE-2
-A DOCKER-ISOLATION-STAGE-1 -i br-00db5844bbb0 ! -o br-00db5844bbb0 -j DOCKER-ISOLATION-STAGE-2
-A DOCKER-ISOLATION-STAGE-1 -j RETURN
#
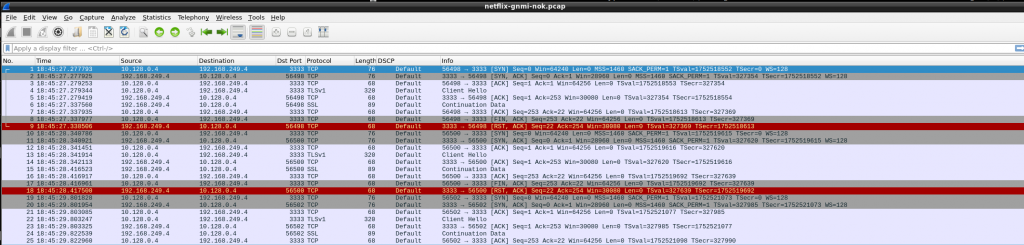
So, restarted gnmi-gateway, still same issue. Ok, I decided to check if the packets were actually hitting r01.
So at first sight, the tcp handshake is established but then there is TCP RST….
So I double checked that gnmi was runnig in my side:
r1#show management api gnmi
Enabled:            Yes
Server:             running on port 3333, in MGMT VRF
SSL Profile:        none
QoS DSCP:           none
r1#
At that moment, I thought that was an issue in cEOS… checking logs I couldnt see any confirmation but I decided to give it a go with vEOS that is more feature rich. So I turned up my GCP lab and followed the same steps with gnmi-gateway. I updated the targets.json with the details of one of my vEOS devices. And run again:
~/gnmi/gnmi-gateway release$ sudo docker run -it --rm -p 59100:59100 -v $(pwd)/examples/gnmi-prometheus/targets.json:/opt/gnmi-gateway/targets.json --name gnmi-gateway-01 --network gnmi-net gnmi-gateway:latest
{"level":"info","time":"2020-11-07T19:22:20Z","message":"Starting GNMI Gateway."}
{"level":"info","time":"2020-11-07T19:22:20Z","message":"Clustering is NOT enabled. No locking or cluster coordination will happen."}
{"level":"info","time":"2020-11-07T19:22:20Z","message":"Starting connection manager."}
{"level":"info","time":"2020-11-07T19:22:20Z","message":"Starting gNMI server on 0.0.0.0:9339."}
{"level":"info","time":"2020-11-07T19:22:20Z","message":"Starting Prometheus exporter."}
{"level":"info","time":"2020-11-07T19:22:20Z","message":"Connection manager received a target control message: 1 inserts 0 removes"}
{"level":"info","time":"2020-11-07T19:22:20Z","message":"Initializing target gcp-r1 ([192.168.249.4:3333]) map[NoTLS:yes]."}
{"level":"info","time":"2020-11-07T19:22:20Z","message":"Target gcp-r1: Connecting"}
{"level":"info","time":"2020-11-07T19:22:20Z","message":"Target gcp-r1: Subscribing"}
{"level":"info","time":"2020-11-07T19:22:20Z","message":"Starting Prometheus HTTP server."}
{"level":"info","time":"2020-11-07T19:22:30Z","message":"Target gcp-r1: Disconnected"}
E1107 19:22:30.048410 1 reconnect.go:114] client.Subscribe (target "gcp-r1") failed: client "gnmi" : client "gnmi" : Dialer(192.168.249.4:3333, 10s): context deadline exceeded; reconnecting in 552.330144ms
{"level":"info","time":"2020-11-07T19:22:40Z","message":"Target gcp-r1: Disconnected"}
E1107 19:22:40.603141 1 reconnect.go:114] client.Subscribe (target "gcp-r1") failed: client "gnmi" : client "gnmi" : Dialer(192.168.249.4:3333, 10s): context deadline exceeded; reconnecting in 1.080381816s
Again, same issue. Let’s see from vEOS perspective.
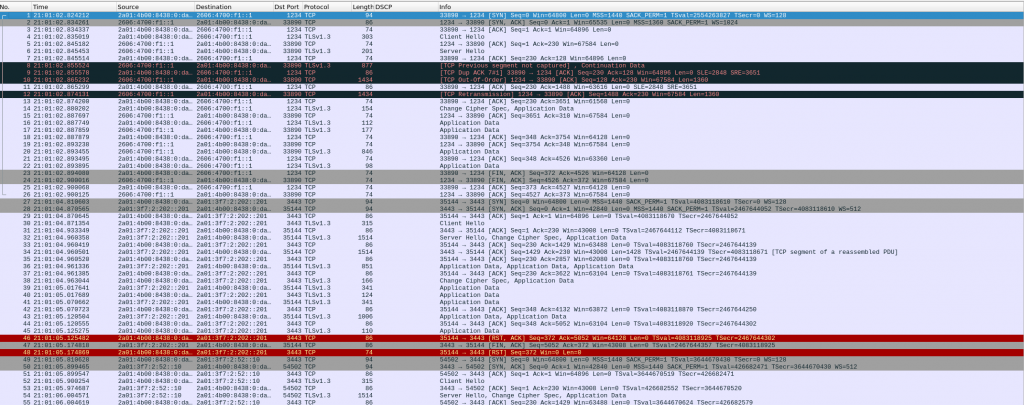
So again in GCP, tcp is established but then TCP RST. As vEOS is my last resort, I tried to dig into that TCP connection. I downloaded a pcap to analyze with wireshark so get a better visual clue…
So, somehow, gnmi-gateway is trying to negotiate TLS!!! As per my understanding, my targets.json was configured with “NoTLS”: “yes” so that should be avoid, shouldn’t be?
At that moment, I wanted to know how to identfiy TLS/SSL packets using tcpdump as it is not always that easy to get quickly a pcap in wireshark. So I found the answer here:
bash-4.2# tcpdump -i any "tcp port 3333 and (tcp[((tcp[12] & 0xf0) >> 2)] = 0x16)"
tcpdump: verbose output suppressed, use -v or -vv for full protocol decode
listening on any, link-type LINUX_SLL (Linux cooked v1), capture size 262144 bytes
19:47:01.367197 In 1e:3d:5b:13:d8:fe (oui Unknown) ethertype IPv4 (0x0800), length 320: 10.128.0.4.50486 > 192.168.249.4.dec-notes: Flags [P.], seq 2715923852:2715924104, ack 2576249027, win 511, options [nop,nop,TS val 1194424180 ecr 1250876], length 252
19:47:02.405870 In 1e:3d:5b:13:d8:fe (oui Unknown) ethertype IPv4 (0x0800), length 320: 10.128.0.4.50488 > 192.168.249.4.dec-notes: Flags [P.], seq 680803294:680803546, ack 3839769659, win 511, options [nop,nop,TS val 1194425218 ecr 1251136], length 252
19:47:04.139458 In 1e:3d:5b:13:d8:fe (oui Unknown) ethertype IPv4 (0x0800), length 320: 10.128.0.4.50490 > 192.168.249.4.dec-notes: Flags [P.], seq 3963338234:3963338486, ack 1760248652, win 511, options [nop,nop,TS val 1194426952 ecr 1251569], length 252
Not something easy to remember 🙁
Ok, I wanted to be sure that gnmi was functional in vEOS and by a quick internet look up, I found this project gnmic! Great job by the author!
So I configured the tool and tested with my vEOS. And worked (without needing TLS)
So, I kind of I was sure that my issue was configuring gnmi-gateway. I tried to troubleshoot it: removed the NoTLS, using the debugging mode, build the code, read the Go code for Target (too complex for my Goland knowledge 🙁 )
So at the end, I gave up and opened an issue with gnmi-gateway author. And he answered super quick with the solution!!! I misunderstood the meaning of “NoTLS” 🙁
So I followed his instructions to configure TLS in my gnmi cEOS config
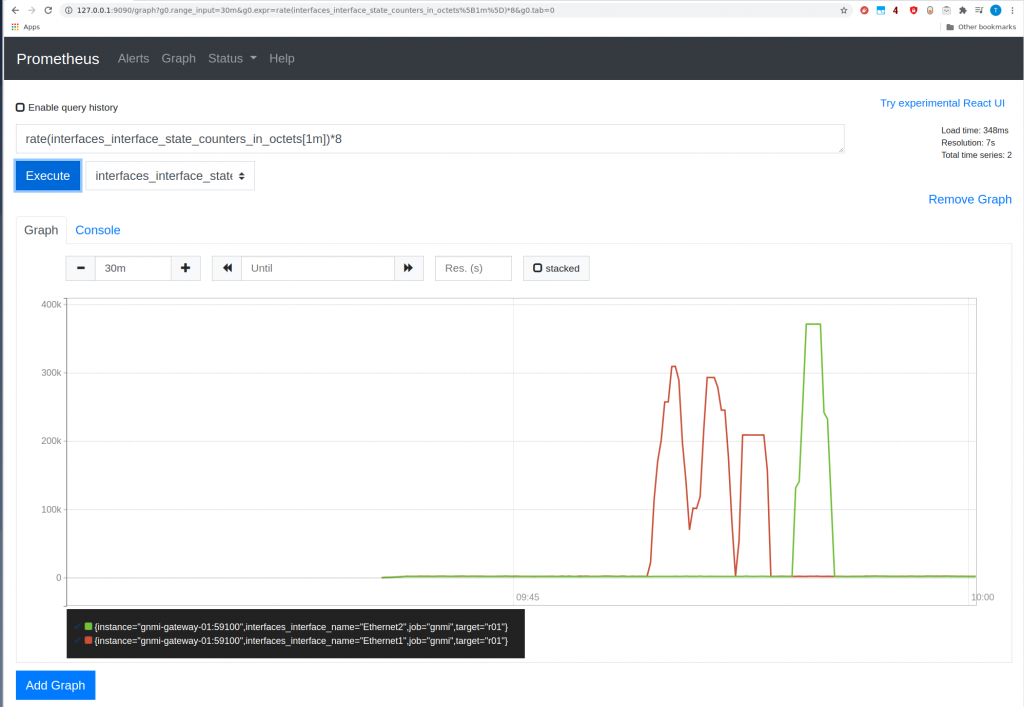
Now we can open prometheus UI and verify if we are consuming data from cEOS r01.
Yeah! it is there.
So all working at then. It has a nice experience. At the end of the day, I want to know more about gNMI/protobuffer, etc. The cold thing here is you can get telemetry and configuration management of your devices. So using gnmi-gateway (that is more for a high availability env like Netflix) and gnmic are great tools to get your head around.
From a new Cloudflare post, I learned that NTS is a standard. To be honest, I can’t remember there was work for making NTP secure. In the last years I have seen development in PTP for time sync in financial systems but nothing else. So it is nice to see this happening. We only need to encrypt BGP and we are done in the internet.. oh wait. Dreaming is free.
So I am trying to install and configure NTS in my system following these links: link1link2
I have just installed ntpsec via debian packages system and that’s it, ntpsec is running…
# apt install ntpsec
...
# service ntpsec status
● ntpsec.service - Network Time Service
Loaded: loaded (/lib/systemd/system/ntpsec.service; enabled; vendor preset: enabled)
Active: active (running) since Sun 2020-10-04 20:35:58 BST; 6min ago
Docs: man:ntpd(8)
Main PID: 292116 (ntpd)
Tasks: 1 (limit: 9354)
Memory: 10.2M
CGroup: /system.slice/ntpsec.service
└─292116 /usr/sbin/ntpd -p /run/ntpd.pid -c /etc/ntpsec/ntp.conf -g -N -u ntpsec:ntpsec
Oct 04 20:36:02 athens ntpd[292116]: DNS: dns_check: processing 3.debian.pool.ntp.org, 8, 101
Oct 04 20:36:02 athens ntpd[292116]: DNS: Pool taking: 81.128.218.110
Oct 04 20:36:02 athens ntpd[292116]: DNS: Pool poking hole in restrictions for: 81.128.218.110
Oct 04 20:36:02 athens ntpd[292116]: DNS: Pool taking: 139.162.219.252
Oct 04 20:36:02 athens ntpd[292116]: DNS: Pool poking hole in restrictions for: 139.162.219.252
Oct 04 20:36:02 athens ntpd[292116]: DNS: Pool taking: 62.3.77.2
Oct 04 20:36:02 athens ntpd[292116]: DNS: Pool poking hole in restrictions for: 62.3.77.2
Oct 04 20:36:02 athens ntpd[292116]: DNS: Pool taking: 213.130.44.252
Oct 04 20:36:02 athens ntpd[292116]: DNS: Pool poking hole in restrictions for: 213.130.44.252
Oct 04 20:36:02 athens ntpd[292116]: DNS: dns_take_status: 3.debian.pool.ntp.org=>good, 8
#
Checking the default config, there is nothing configured to use NTS so I made some changes based on the links above:
# vim /etc/ntpsec/ntp.conf
...


# Public NTP servers supporting Network Time Security:
server time.cloudflare.com:1234 nts

# Example 2: NTS-secured NTP (default NTS-KE port (123); using certificate pool of the operating system)
server ntp1.glypnod.com iburst minpoll 3 maxpoll 6 nts

#Via https://www.netnod.se/time-and-frequency/how-to-use-nts
server nts.ntp.se:3443 nts iburst
server nts.sth1.ntp.se:3443 nts iburst
server nts.sth2.ntp.se:3443 nts iburst
After restart, still not seeing NTS in sync 🙁
# service ntpsec restart
...
# ntpq -puw
remote refid st t when poll reach delay offset jitter
time.cloudflare.com .NTS. 16 0 - 64 0 0ns 0ns 119ns
ntp1.glypnod.com .NTS. 16 5 - 32 0 0ns 0ns 119ns
2a01:3f7:2:202::202 .NTS. 16 1 - 64 0 0ns 0ns 119ns
2a01:3f7:2:52::11 .NTS. 16 1 - 64 0 0ns 0ns 119ns
2a01:3f7:2:62::11 .NTS. 16 1 - 64 0 0ns 0ns 119ns
0.debian.pool.ntp.org .POOL. 16 p - 256 0 0ns 0ns 119ns
1.debian.pool.ntp.org .POOL. 16 p - 256 0 0ns 0ns 119ns
2.debian.pool.ntp.org .POOL. 16 p - 256 0 0ns 0ns 119ns
3.debian.pool.ntp.org .POOL. 16 p - 64 0 0ns 0ns 119ns
-229.191.57.185.no-ptr.as201971.net .GPS. 1 u 25 64 177 65.754ms 26.539ms 7.7279ms
+ns3.turbodns.co.uk 85.199.214.99 2 u 23 64 177 12.200ms 2.5267ms 1.5544ms
+time.cloudflare.com 10.21.8.19 3 u 25 64 177 5.0848ms 2.6248ms 2.6293ms
-ntp1.wirehive.net 202.70.69.81 2 u 21 64 177 9.6036ms 2.3986ms 1.9814ms
+ns4.turbodns.co.uk 195.195.221.100 2 u 21 64 177 10.896ms 2.9528ms 1.5288ms
-lond-web-1.speedwelshpool.com 194.58.204.148 2 u 23 64 177 5.6202ms 5.8218ms 3.2582ms
-time.shf.uk.as44574.net 85.199.214.98 2 u 29 64 77 9.0190ms 4.9419ms 2.5810ms
lux.22pf.org .INIT. 16 u - 64 0 0ns 0ns 119ns
ns1.thorcom.net .INIT. 16 u - 64 0 0ns 0ns 119ns
time.cloudflare.com .INIT. 16 u - 64 0 0ns 0ns 119ns
time.rdg.uk.as44574.net .INIT. 16 u - 64 0 0ns 0ns 119ns
-herm4.doylem.co.uk 185.203.69.150 2 u 19 64 177 15.024ms 9.5098ms 3.2011ms
-213.251.53.217 193.62.22.74 2 u 17 64 177 5.7211ms 1.4122ms 2.1895ms
*babbage.betadome.net 85.199.214.99 2 u 20 64 177 4.8614ms 4.1187ms 2.5533ms
#
#
# ntpq -c nts
NTS client sends: 56
NTS client recvs good: 0
NTS client recvs w error: 0
NTS server recvs good: 0
NTS server recvs w error: 0
NTS server sends: 0
NTS make cookies: 0
NTS decode cookies: 0
NTS decode cookies old: 0
NTS decode cookies too old: 0
NTS decode cookies error: 0
NTS KE probes good: 8
NTS KE probes_bad: 0
NTS KE serves good: 0
NTS KE serves_bad: 0
#
I ran tcpdump filtering on TCP ports 1234 (cloudflare) and 3443 (netnod), and I can see my system trying to negotiate NTS with Cloudflare and NetNod but both sessions are TCP RST 🙁
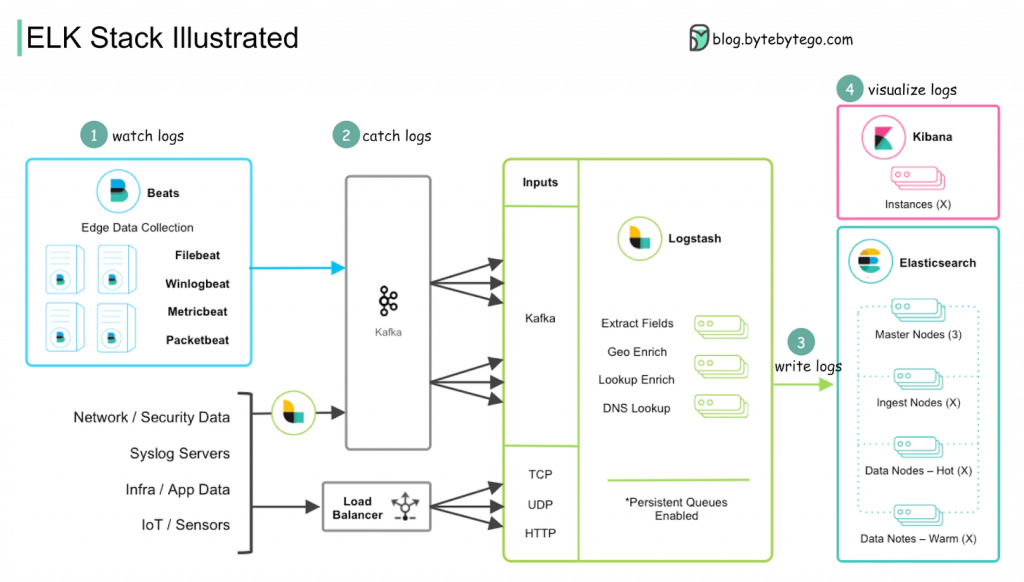
As usual, I am following Anton’s blog and now I want to follow his series about Protobuf/gNMI. All merit and hard work is for the author. I am just doing copy/paste. All his code related to this topic is in his github repo:
First time I heard about protobuf was in the context of telemetry from Arista LANZ (44.3.7)
Now it is my chance to get some knowledge about it. Protobuf is a new data encoding type (like JSON) meant for speed mainly. Mayor things, this is a binary protocol. And we are going to use Protobuf to encode YANG/OpenConfig. And the transport protocol is going to be gNMI.
Index
0- Create python env
1- Install protobuf
2- Create and compile protobuf file for the OpenConfig modules openconfig-interfaces.yang.
3- Create python script to write protobuf message based on the model compiled earlier
4- Create python script to read that protobuf message
5- Use gNMI: Create python script to get interface configuration from cEOS
This is a quite difficult part. Try to install “pyang” for python and clone openconfig. Keep in mind that I have removed “ro” entries manually below:
$ ls -ltr
total 11
-rw-r--r-- 1 tomas tomas 1240 Aug 19 18:37 README.md
-rw-r--r-- 1 tomas tomas 11358 Aug 19 18:37 LICENSE
drwxr-xr-x 3 tomas tomas 4 Aug 19 18:37 release
drwxr-xr-x 4 tomas tomas 12 Aug 19 18:37 doc
drwxr-xr-x 3 tomas tomas 4 Aug 19 18:37 third_party
$
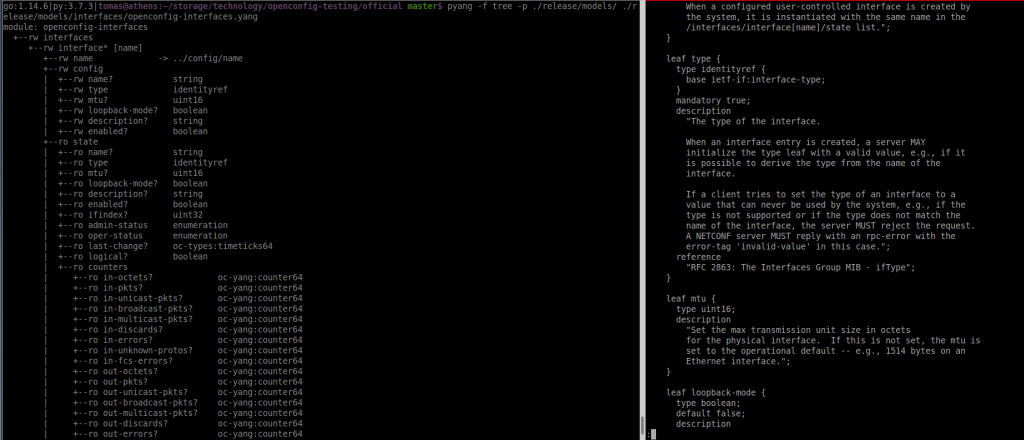
$ pyang -f tree -p ./release/models/ ./release/models/interfaces/openconfig-interfaces.yang
module: openconfig-interfaces
+--rw interfaces
+--rw interface* [name]
+--rw name -> ../config/name
+--rw config
| +--rw name? string
| +--rw type identityref
| +--rw mtu? uint16
| +--rw loopback-mode? boolean
| +--rw description? string
| +--rw enabled? boolean
+--rw hold-time
| +--rw config
| | +--rw up? uint32
| | +--rw down? uint32
+--rw subinterfaces
+--rw subinterface* [index]
+--rw index -> ../config/index
+--rw config
+--rw index? uint32
+--rw description? string
+--rw enabled? boolean
So this is the YANG model that we want to transform into protobuf.
To be honest, If I have to match that output with the content of the file itself, I dont understant it.
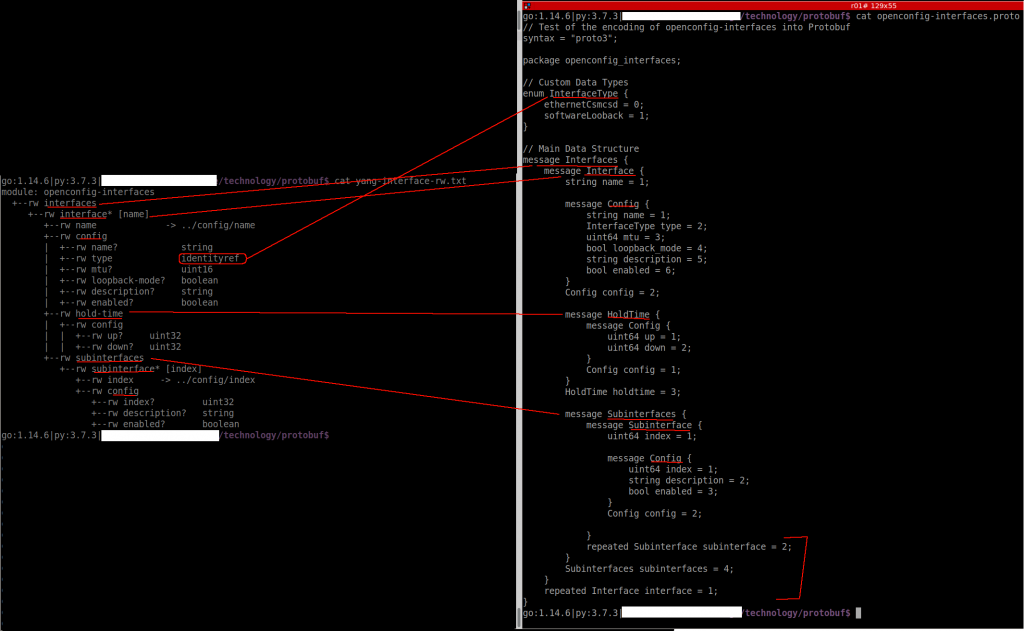
As Anton mentions, you need to check the official protobuf guide and protobuf python guide to create the proto file for the interface YANG model. These two links explain the structure of our new protofile.
In one side, I think I understand the process of converting YANG to Protobug. But I should try something myself to be sure 🙂
The .proto code doesn’t appear properly formatted in my blog so you can see it in the fig above or in github.
Compile:
$ protoc -I=. --python_out=. openconfig_interfaces.proto
$ ls -ltr | grep openconfig_interfaces
-rw-r--r-- 1 tomas tomas 1247 Aug 20 14:01 openconfig_interfaces.proto
-rw-r--r-- 1 tomas tomas 20935 Aug 20 14:03 openconfig_interfaces_pb2.py
3- Create python script to write protobuf
The script has a dict “intend” to be used to populate the proto message. Once it is populated with the info, it is written to a file as byte stream.
$ python create_protobuf.py oc_if.bin
$ file oc_if.bin
oc_if.bin: data
4- Create python script to read protobuf
This is based on the next blog entry of Anton’s series.
The script that read the protobuf message is here.
The challenge here is how he found out what files to use.
$ ls -ltr gnmi/proto/gnmi/
total 62
-rw-r--r-- 1 tomas tomas 21907 Aug 20 15:10 gnmi.proto
-rw-r--r-- 1 tomas tomas 125222 Aug 20 15:10 gnmi.pb.go
-rw-r--r-- 1 tomas tomas 76293 Aug 20 15:10 gnmi_pb2.py
-rw-r--r-- 1 tomas tomas 4864 Aug 20 15:10 gnmi_pb2_grpc.py
$
$ ls -ltr gnmi/proto/gnmi_ext/
total 14
-rw-r--r-- 1 tomas tomas 2690 Aug 20 15:10 gnmi_ext.proto
-rw-r--r-- 1 tomas tomas 19013 Aug 20 15:10 gnmi_ext.pb.go
-rw-r--r-- 1 tomas tomas 10191 Aug 20 15:10 gnmi_ext_pb2.py
-rw-r--r-- 1 tomas tomas 83 Aug 20 15:10 gnmi_ext_pb2_grpc.py
$
I can see the blog and github doesnt match and I can’t really follow. Based on that, I have created an script to get the interface config from one cEOS switch using gNMI interface:
$ cat gnmi_get_if_config.py
#!/usr/bin/env python

# Modules
import grpc
from bin.gnmi_pb2_grpc import *
from bin.gnmi_pb2 import *
import json
import pprint

# Own modules
from bin.PathGenerator import gnmi_path_generator

# Variables
path = {'inventory': 'inventory.json'}
info_to_collect = ['openconfig-interfaces:interfaces']


# User-defined functions
def json_to_dict(path):
    with open(path, 'r') as f:
        return json.loads(f.read())


# Body
if __name__ == '__main__':
    inventory = json_to_dict(path['inventory'])

    for td_entry in inventory['devices']:
        metadata = [('username', td_entry['username']), ('password', td_entry['password'])]

        channel = grpc.insecure_channel(f'{td_entry["ip_address"]}:{td_entry["port"]}', metadata)
        grpc.channel_ready_future(channel).result(timeout=5)

        stub = gNMIStub(channel)

        for itc_entry in info_to_collect:
            print(f'Getting data for {itc_entry} from {td_entry["hostname"]} over gNMI...\n')

            intent_path = gnmi_path_generator(itc_entry)
            print("gnmi_path:\n")
            print(intent_path)
            gnmi_message_request = GetRequest(path=[intent_path], type=0, encoding=4)
            gnmi_message_response = stub.Get(gnmi_message_request, metadata=metadata)
            # we get the outout of gnmi_response that is json as string of bytes
            x = gnmi_message_response.notification[0].update[0].val.json_ietf_val
            # decode the string of bytes as string and then transform to pure json
            y = json.loads(x.decode('utf-8'))
            #import ipdb; ipdb.set_trace()
            # print nicely json
            pprint.pprint(y)
This is my cEOS config:
r01#show management api gnmi
Enabled: Yes
Server: running on port 3333, in default VRF
SSL Profile: none
QoS DSCP: none
r01#
r01#
r01#show version
cEOSLab
Hardware version:
Serial number:
Hardware MAC address: 0242.ac8d.adef
System MAC address: 0242.ac8d.adef
Software image version: 4.23.3M
Architecture: i686
Internal build version: 4.23.3M-16431779.4233M
Internal build ID: afb8ec89-73bd-4410-b090-f000f70505bb
cEOS tools version: 1.1
Uptime: 6 weeks, 1 days, 3 hours and 13 minutes
Total memory: 8124244 kB
Free memory: 1923748 kB
r01#
r01#
r01#show ip interface brief
Address
Interface IP Address Status Protocol MTU Owner

Ethernet1 10.0.12.1/30 up up 1500
Ethernet2 10.0.13.1/30 up up 1500
Loopback1 10.0.0.1/32 up up 65535
Loopback2 192.168.0.1/32 up up 65535
Vlan100 1.1.1.1/24 up up 1500
r01#
And it seems to work:
$ python gnmi_get_if_config.py
Getting data for openconfig-interfaces:interfaces from r01 over gNMI…
gnmi_path:
origin: "openconfig-interfaces"
elem {
name: "interfaces"
}
{'openconfig-interfaces:interface': [{'config': {'arista-intf-augments:load-interval': 300,
'description': '',
'enabled': True,
'loopback-mode': False,
'mtu': 0,
'name': 'Ethernet2',
'openconfig-vlan:tpid': 'openconfig-vlan-types:TPID_0X8100',
'type': 'iana-if-type:ethernetCsmacd'},
Summary
It has been be interesting to play with ProtoBug and gNMI but I have just grasped the surface.
########################
# Go configuration
########################
#
# git clone -b v0.0.4 https://github.com/wfarr/goenv.git $HOME/.goenv
if [ ! -d "$HOME/.goenv" ]; then
    git clone https://github.com/syndbg/goenv.git $HOME/.goenv
fi
#export GOPATH="$HOME/storage/golang/go"
#export GOBIN="$HOME/storage/golang/go/bin"
#export PATH="$GOPATH/bin:$PATH"
if [ -d "$HOME/.goenv"   ]
then
    export GOENV_ROOT="$HOME/.goenv"
    export PATH="$GOENV_ROOT/bin:$PATH"
    if  type "goenv" &> /dev/null; then
        eval "$(goenv init -)"
        # Add the version to my prompt
        __goversion (){
            if  type "goenv" &> /dev/null; then
                goenv_go_version=$(goenv version | sed -e 's/ .*//')
                printf $goenv_go_version
            fi
        }
        export PS1="go:\$(__goversion)|$PS1"
        export PATH="$GOROOT/bin:$PATH"
        export PATH="$PATH:$GOPATH/bin"
    fi
fi

################## End GoLang #####################
Then started a new bash session to trigger the installation of goenv and then install a go version
$ goenv install 1.14.6
$ goenv global 1.14.6
Now we can start the docker containers for influx and grafana:
sudo docker-compose up -d    // start containers
sudo docker-compose down -v  // for stopping containers

sudo docker ps -a
CONTAINER ID IMAGE COMMAND CREATED STATUS PORTS NAMES
cad339ead2ee influxdb:latest "/entrypoint.sh -con…" 5 hours ago Up 5 hours 0.0.0.0:4242->4242/tcp, 0.0.0.0:8083->8083/tcp, 0.0.0.0:8086->8086/tcp influxdb-tele
ef88acc47ee3 grafana/grafana "/run.sh" 5 hours ago Up 5 hours 0.0.0.0:3000->3000/tcp grafana-tele

sudo docker network ls
NETWORK ID NAME DRIVER SCOPE
fe19e7876636 bridge bridge local
0a8770578f3f host host local
6e128a7682f1 none null local
3d27d0ed3ab3 telemetry_monitoring bridge local

sudo docker network inspect telemetry_monitoring
[
{
"Name": "telemetry_monitoring",
"Id": "3d27d0ed3ab3b0530441206a128d849434a540f8e5a2c109ee368b01052ed418",
"Created": "2020-08-12T11:22:03.05783331Z",
"Scope": "local",
"Driver": "bridge",
"EnableIPv6": false,
"IPAM": {
"Driver": "default",
"Options": null,
"Config": [
{
"Subnet": "172.18.0.0/16",
"Gateway": "172.18.0.1"
}
]
},
"Internal": false,
"Attachable": true,
"Ingress": false,
"ConfigFrom": {
"Network": ""
},
"ConfigOnly": false,
"Containers": {
"cad339ead2eeb0b479bd6aa024cb2150fb1643a0a4a59e7729bb5ddf088eba19": {
"Name": "influxdb-tele",
"EndpointID": "e3c7f853766ed8afe6617c8fac358b3302de41f8aeab53d429ffd1a28b6df668",
"MacAddress": "02:42:ac:12:00:03",
"IPv4Address": "172.18.0.3/16",
"IPv6Address": ""
},
"ef88acc47ee30667768c5af9bbd70b95903d3690c4d80b83ba774b298665d15d": {
"Name": "grafana-tele",
"EndpointID": "3fe2b424cbb66a93e9e06f4bcc2e7353a0b40b2d56777c8fee8726c96c97229a",
"MacAddress": "02:42:ac:12:00:02",
"IPv4Address": "172.18.0.2/16",
"IPv6Address": ""
}
},
"Options": {},
"Labels": {
"com.docker.compose.network": "monitoring",
"com.docker.compose.project": "telemetry"
}
}
]
Now we have to generate the octsdb binary and copy it to the switches as per instructions
$ go get github.com/aristanetworks/goarista/cmd/octsdb
$ cd $GOPATH/src/github.com/aristanetworks/goarista/cmd/octsdb

$ GOOS=linux GOARCH=386 go build   // I used this one
$ GOOS=linux GOARCH=amd64 go build // if you use EOS 64 Bits

$ scp octsdb user@SWITCH_IP:/mnt/flash/
An important thing is the configuration file for octsdb. I struggled trying to get a config file that provided me CPU and interface counters. All the examples are based on hardware platforms but I am using containers/VMs. But using this other blog post, I worked out the path for the interfaces in vEOS.
TermiAttr it is listening on 0.0.0.0:6042. “octsdb” is using the mgmt IP 192.168.249.4 (that is in MGMT vrf) to connect to the influxdb container that is running in 10.128.0.4:4242
Verify that things are running:
# From the switch
show agent octsdb log
# From InfluxDB container
$ sudo docker exec -it influxdb-tele bash
root@cad339ead2ee:/# influx -precision 'rfc3339'
Connected to http://localhost:8086 version 1.8.1
InfluxDB shell version: 1.8.1
> show databases
name: databases
name
----
grpc
_internal
> use grpc
Using database grpc
> show measurements
name: measurements
name
----
eos.corecpu.cpu.utilization._counts
eos.corecpu.cpu.utilization.cpu.0
eos.corecpu.cpu.utilization.total
eos.intfcounter.counter.discards
eos.intfcounter.counter.errors
eos.intfcounter.counter.octets
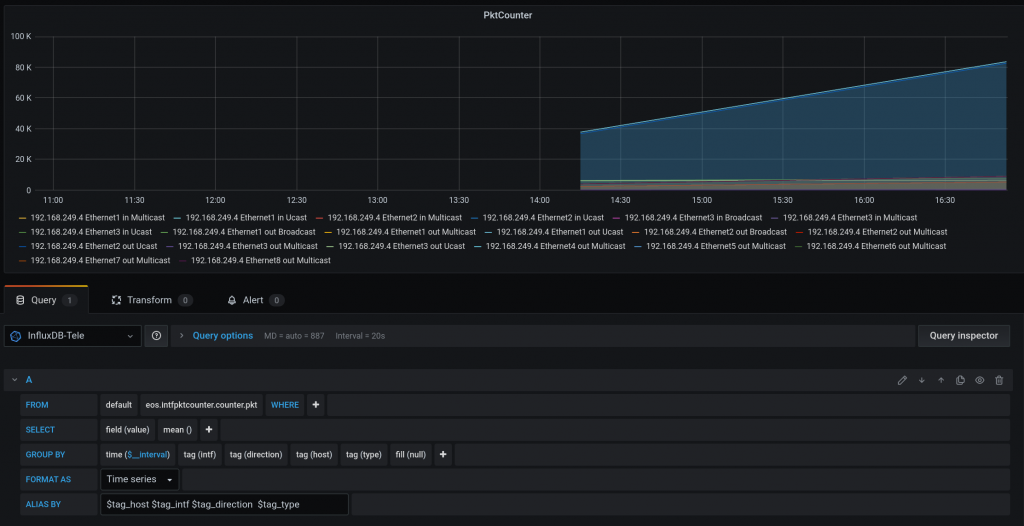
eos.intfpktcounter.counter.pkt
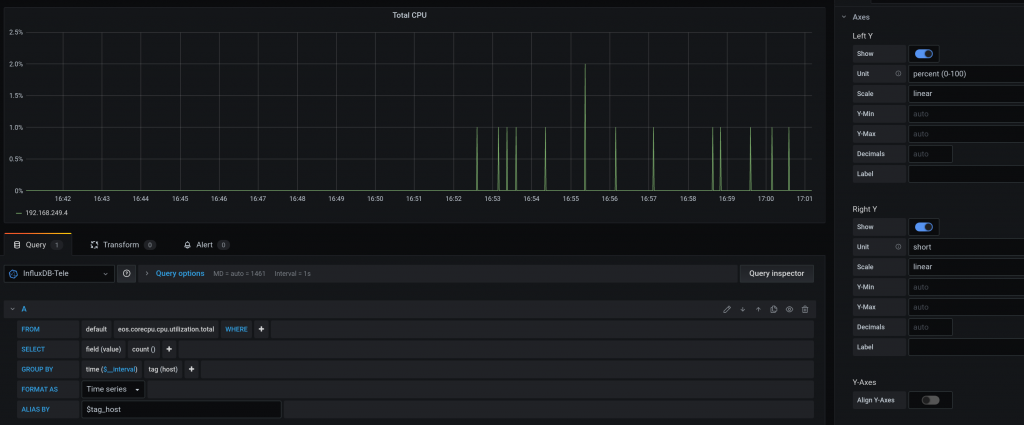
eos.totalcpu.cpu.utilization.total
> exit
root@cad339ead2ee:/# exit
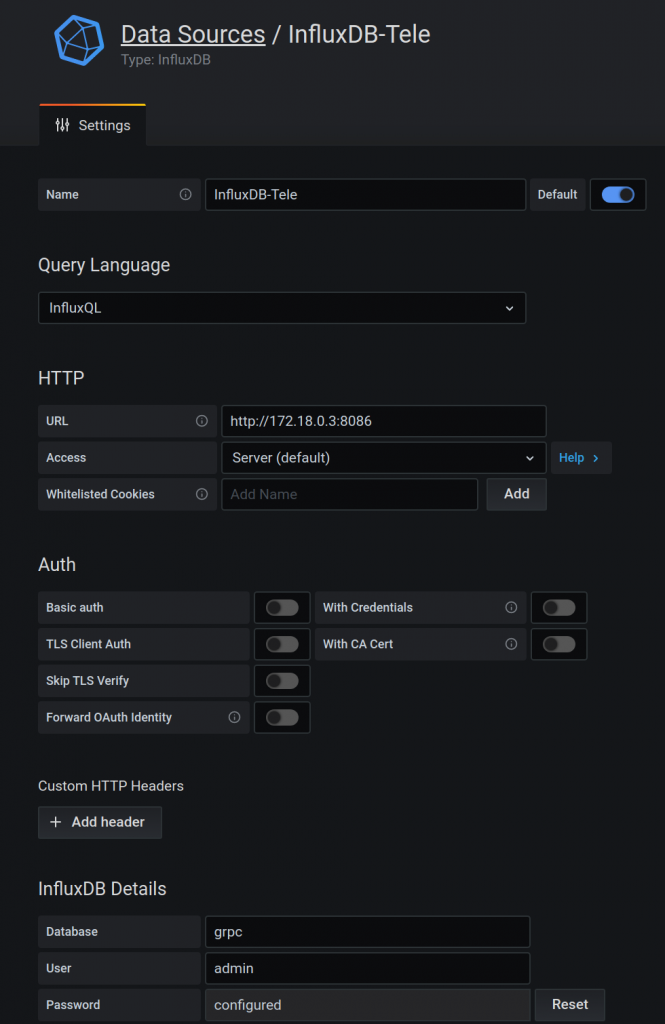
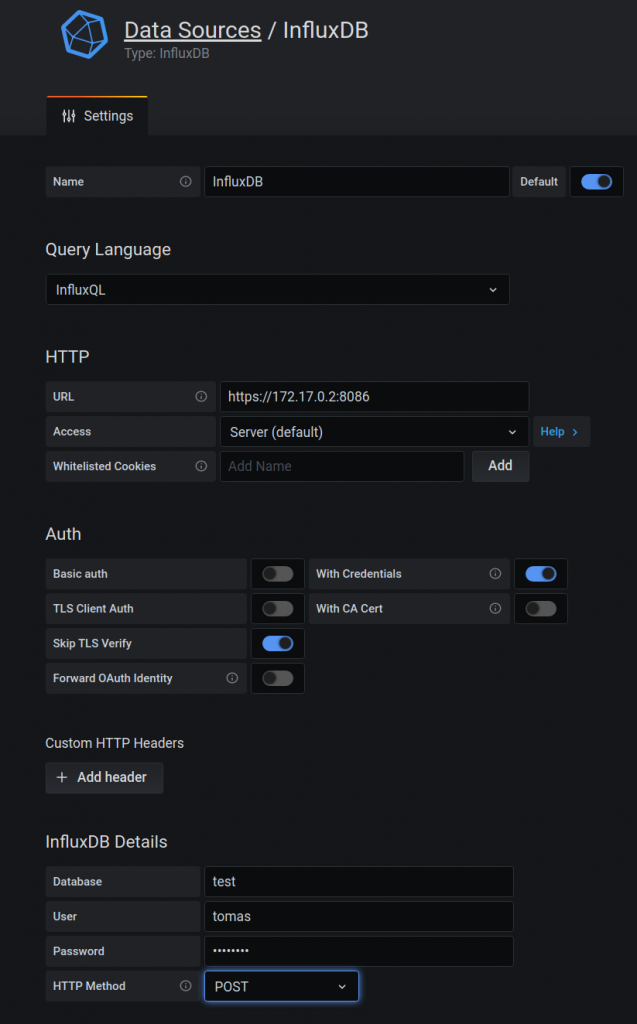
Now we need to configure grafana. So first we create a connection to influxdb. Again, I struggled with the URL. Influx and grafana are two containers running in the same host. I was using initially localhost and it was failing. At the end I had to find out the IP assigned to the influxdb container and use it.
Now you can create a dashboard with panels.
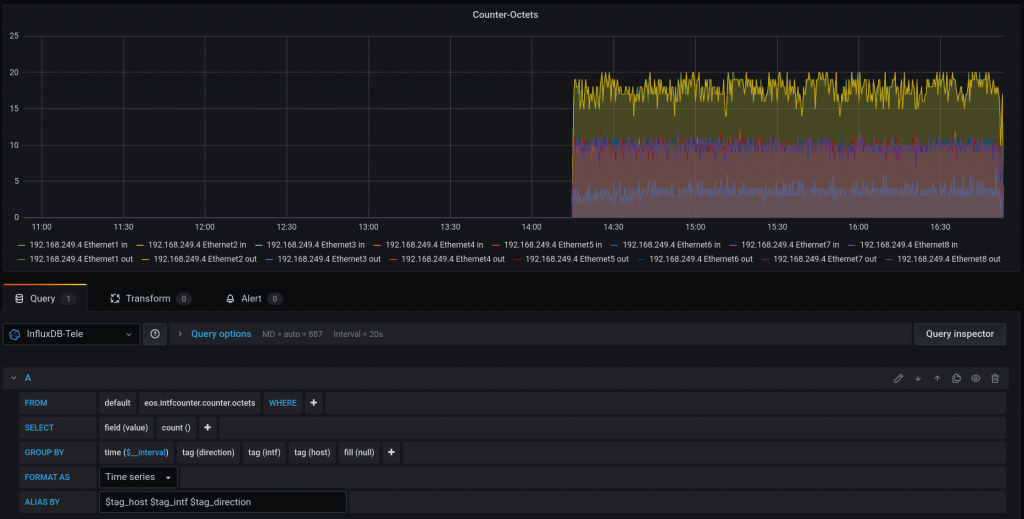
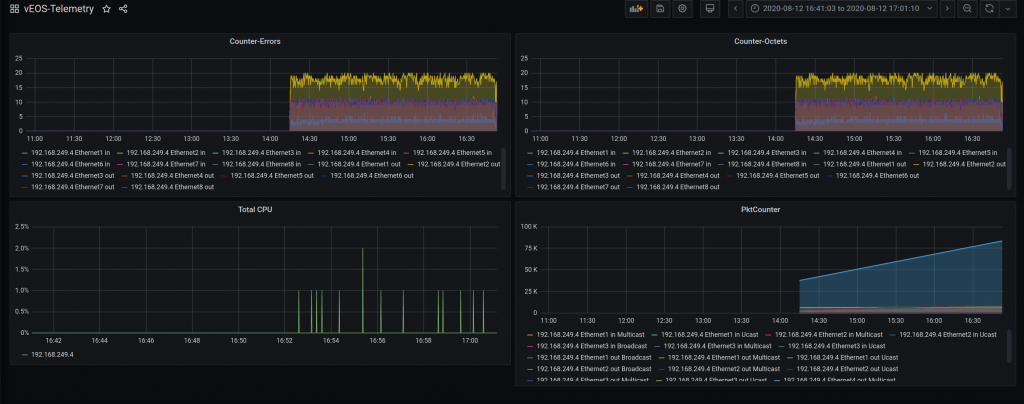
For octet counters:
For packet types:
For CPU usage:
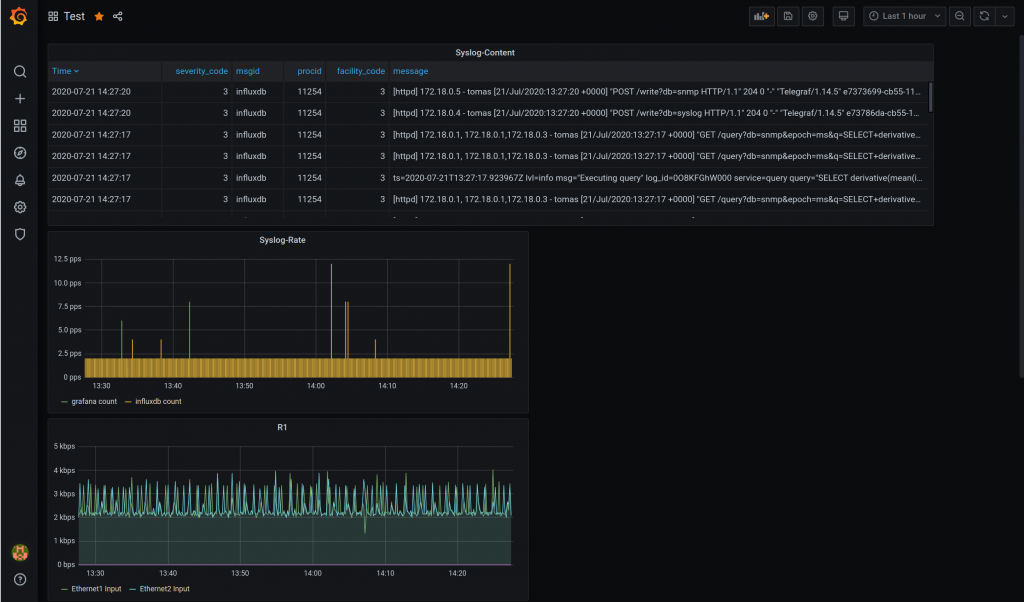
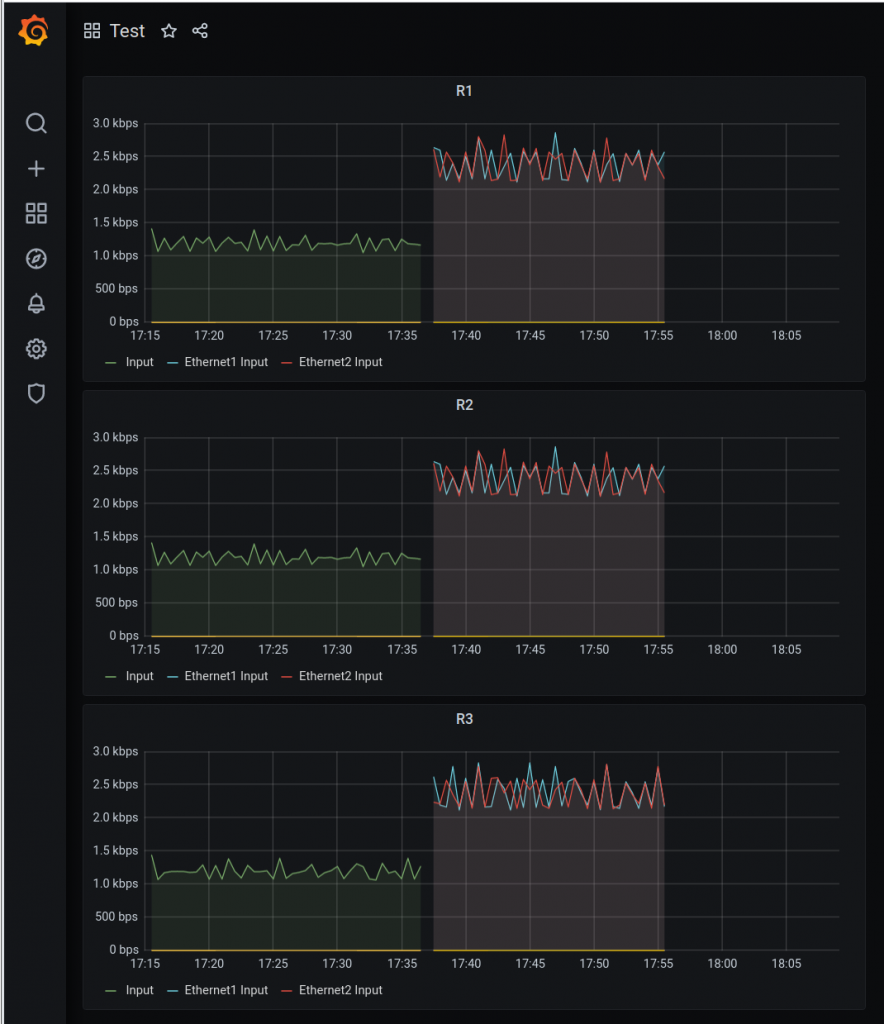
And this is the dashboard:
Keep in mind that I am not 100% sure my grafana panels are correct for CPU and Counters (PktCounter makes sense)
At some point, I want to try telemetry for LANZ via this telerista plugin.
This a continuation of the last blog entry. This time we are going to gather syslog messages from the monitoring containers and it is going to be deployed by ansible!
As usual, all this is based on Anton’s Karneliuk blog post. All credits to him.
So initially we built a monitoring stack with InfluxDB, Telegraf and Grafana manually to gather and visualise SNMP infor form the Arista cEOS switches.
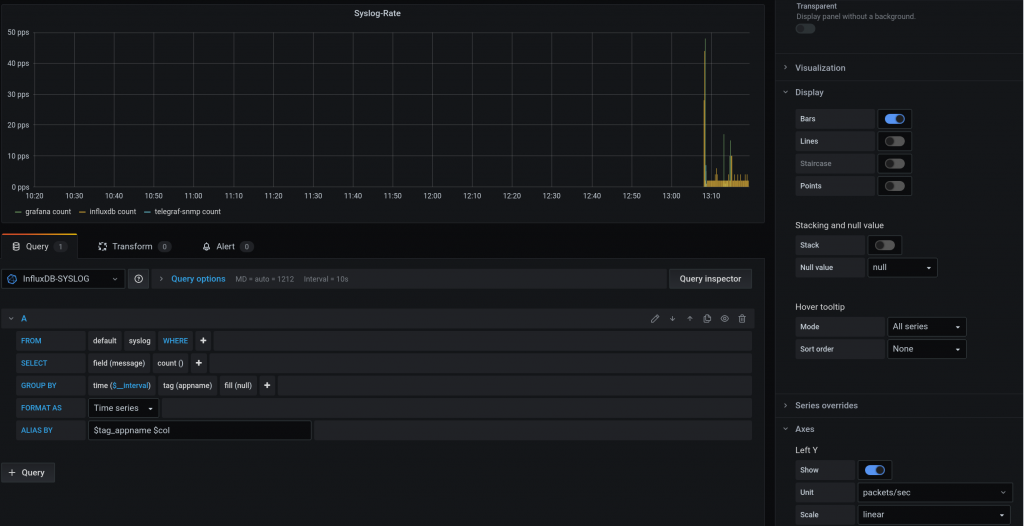
This time, we are going to send SYSLOG from the monitoring stack containers to a new Telegraf instance.
Ideally, we would like to send Syslog from the cEOS devices but as Anton mentions, the syslog rfc3164 that most network kit implements, it is not supported (yet) by telegraf, that supports rfc5424.
You can read more info about this in all these links:
The very first time, if you pay attention to the ansible logging, everything should success. If for any reason you have to make changes or troubleshoot, and execute again the full playbook, some tasks will fail, but not the playbook (this is done with ignore_errors: yes inside a task). For example, the docker network creation will fail as it is already there. The same if you try to create the user and dbs in a already running influx instance.
That playbook just calls the role “monitoring_stack“. The main playbook in that role will create the docker network where all containers will be attached, all the containers and do something hacky with iptables.
As the cEOS lab is built (using docker-topo) independently of this playbook, there are already some iptables rules in place, and somehow, when executing the role, the rules change and it blocks the new network for any outbound connectivity.
Before the iptables change in the playbook:
# iptables -t filter -S DOCKER-ISOLATION-STAGE-1
Warning: iptables-legacy tables present, use iptables-legacy to see them
-N DOCKER-ISOLATION-STAGE-1
-A DOCKER-ISOLATION-STAGE-1 -i br-4bd17cfa19a8 ! -o br-4bd17cfa19a8 -j DOCKER-ISOLATION-STAGE-2
-A DOCKER-ISOLATION-STAGE-1 -j ACCEPT
-A DOCKER-ISOLATION-STAGE-1 -i br-94c1e813ad6f ! -o br-94c1e813ad6f -j DOCKER-ISOLATION-STAGE-2
-A DOCKER-ISOLATION-STAGE-1 -i br-13ab2b6a0d1d ! -o br-13ab2b6a0d1d -j DOCKER-ISOLATION-STAGE-2
-A DOCKER-ISOLATION-STAGE-1 -i br-00db5844bbb0 ! -o br-00db5844bbb0 -j DOCKER-ISOLATION-STAGE-2
-A DOCKER-ISOLATION-STAGE-1 -i br-121978ca0282 ! -o br-121978ca0282 -j DOCKER-ISOLATION-STAGE-2
-A DOCKER-ISOLATION-STAGE-1 -i docker0 ! -o docker0 -j DOCKER-ISOLATION-STAGE-2
-A DOCKER-ISOLATION-STAGE-1 -j RETURN
#
# iptables -t filter -S DOCKER-ISOLATION-STAGE-2
Warning: iptables-legacy tables present, use iptables-legacy to see them
-N DOCKER-ISOLATION-STAGE-2
-A DOCKER-ISOLATION-STAGE-2 -o br-4bd17cfa19a8 -j DROP
-A DOCKER-ISOLATION-STAGE-2 -o br-94c1e813ad6f -j DROP
-A DOCKER-ISOLATION-STAGE-2 -o br-13ab2b6a0d1d -j DROP
-A DOCKER-ISOLATION-STAGE-2 -o br-00db5844bbb0 -j DROP
-A DOCKER-ISOLATION-STAGE-2 -o br-121978ca0282 -j DROP
-A DOCKER-ISOLATION-STAGE-2 -o docker0 -j DROP
-A DOCKER-ISOLATION-STAGE-2 -j RETURN
I want to avoid DOCKER-ISOLATION-STAGE-2 so I want the “-A DOCKER-ISOLATION-STAGE-1 -j ACCEPT” on top of that chain.
This is not the first (neither last) time that this issue bites me. I need to review carefully the docker-topo file and really get me head around the networking expectations from docker.
Another thing about docker networking that bites me very often. In my head, each monitoring has an IP. For example influxdb is 172.18.0.2 and telegraf-syslog is 172.18.0.4. We have configured influxdb to send syslog to telegraf-syslog container so I would expect the influxdb container to use its 0.2 and everything is local (no forwarding, no firewall, etc0. But not, it uses the host ip, 172.18.0.1.
Apart from that, there are several things that I had to review while adapting the role to my environment regarding docker and ansible.
docker documentation:
how to create network: https://docs.docker.com/engine/reference/commandline/network_create/
how to configure container logs: https://docs.docker.com/engine/reference/commandline/container_logs/
how to configure the logging driver in a container: https://docs.docker.com/config/containers/logging/configure/
how to configure syslog in a container: https://docs.docker.com/config/containers/logging/syslog/
how to run commands from a running container: https://docs.docker.com/engine/reference/commandline/exec/
ansible documentation:
become – run comamnds with sudo in a playbook: https://docs.ansible.com/ansible/latest/user_guide/become.html (–ask-become-pass, -K)
grafana data source module: https://docs.ansible.com/ansible/latest/modules/grafana_datasource_module.html
This is important because via ansible, I had to workout the meaning of become, how to add the syslog config in the containers and add grafana datasources via a module.
This is something I wanted to try for some time. Normally for networks monitoring you use a NMS tool. They can be expensive, free or cheap. I have seen/used Observium and LibreNMS. And many years ago Cacti. There are other tools that can do the job like Zabbix/Nagios/Icinga.
But it seems time-series-databases are the new standard. They give you more flexibility as you can create queries and graph them.
I decided for InfluxDB-Telegraf-Grafana stuck as I could find quickly info based on scenarios of networks.
What is the rule of eachc one:
Telegraf: collect data InfluxDB: store data Grafana: visualize
My main source is again Anton’s blog. All credits to him.
Environment
My network is just 3 Arista ceos containers via docker. All services will run as containers so you need docker installed. Everything is IPv4.
InfluxDB
Installation:
// Create directories
mkdir telemetry-example/influxdb
cd telemetry-example/influxdb

// Get influxdb config
docker run --rm influxdb influxd config > influxdb.conf

// Create local data folder for influxdb that we will map
mkdir data
ls -ltr

// Check docker status
docker images
docker ps -a

// Create docker instance for influxdb. Keep in  mind that I am giving a name to the instance

docker run -d -p 8086:8086 -p 8088:8088 --name influxdb \
-v $PWD/influxdb.conf:/etc/influxdb/influxdb.conf:ro \
-v $PWD/data:/var/lib/influxdb \
influxdb -config /etc/influxdb/influxdb.conf

// Verify connectivity
curl -i http://localhost:8086/ping

// Create database "test" using http-query (link below for more details)
curl -XPOST http://localhost:8086/query --data-urlencode "q=CREATE DATABASE test"
{"results":[{"statement_id":0}]} <-- command was ok!

// Create user/pass for your db.
curl -XPOST http://localhost:8086/query --data-urlencode "q=CREATE USER xxx WITH PASSWORD 'xxx123' WITH ALL PRIVILEGES"
{"results":[{"statement_id":0}]} <-- command was ok!

// Create SSL cert for influxdb
docker exec -it influxdb openssl req -x509 -nodes -newkey rsa:2048 -keyout /etc/ssl/influxdb-selfsigned.key -out /etc/ssl/influxdb-selfsigned.crt -days 365 -subj "/C=GB/ST=LDN/L=LDN/O=domain.com/CN=influxdb.domain.com"

// Update influxdb.conf for SSL
telemetry-example/influxdb$ vim influxdb.conf
…
https-enabled = true
https-certificate = "/etc/ssl/influxdb-selfsigned.crt"
https-private-key = "/etc/ssl/influxdb-selfsigned.key"
…

// Restart influxdb to take the changes
docker restart influxdb

// Get influxdb IP for using it later
docker container inspect influxdb --format='{{ .NetworkSettings.IPAddress }}'
172.17.0.2

// Verify connectivity via https
curl -i https://localhost:8086/ping --insecure
The verification for HTTPS was a bit more difficult because the result was always correct no matter what query I was running:
So I decided to see if there was cli/shell for the influxdb (like in mysql, etc). And yes, there is one. Keep in mind that you have to use “-ssl -unsafeSsl” at the same time! That confused me a lot.
$ docker exec -it influxdb influx -ssl -unsafeSsl
Connected to https://localhost:8086 version 1.8.1
InfluxDB shell version: 1.8.1
> show databases
name: databases
name
_internal
test
> use test
Using database test
> show series
key
cpu,cpu=cpu-total,host=5f7aa2c5550e
Links about influxdb that are good for the docker creation and the http queries:
// Create dir
mkdir telemetry-example/telegraf
cd telemetry-example/telegraf

// Get config file to be modified
docker run --rm telegraf telegraf config > telegraf.conf

// Add the details of influxdb in telegraf.conf. As well, you need to add the devices you want to poll. In my case 172.23.0.2/3/4.

vim telegraf.conf
....
[[outputs.influxdb]]
urls = ["https://172.17.0.2:8086"]
database = "test"
skip_database_creation = false
## Timeout for HTTP messages.
timeout = "5s"
## HTTP Basic Auth
username = "xxx"
password = "xxx123"
## Use TLS but skip chain & host verification
insecure_skip_verify = true
# Retrieves SNMP values from remote agents
[[inputs.snmp]]
## Agent addresses to retrieve values from.
## example: agents = ["udp://127.0.0.1:161"]
## agents = ["tcp://127.0.0.1:161"]
agents = ["udp://172.23.0.2:161","udp://172.23.0.3:161","udp://172.23.0.4:161"]
#
## Timeout for each request.
timeout = "5s"
#
## SNMP version; can be 1, 2, or 3.
version = 2
#
## SNMP community string.
community = "tomas123"
#
## Number of retries to attempt.
retries = 3
This is the SNMP config I added below the SNMPv3 options in [[inputs.snmp]]
#   ## Add fields and tables defining the variables you wish to collect.  This
#   ## example collects the system uptime and interface variables.  Reference the
#   ## full plugin documentation for configuration details.

  [[inputs.snmp.field]]
    name = "hostname"
    oid = "RFC1213-MIB::sysName.0"
    is_tag = true

  [[inputs.snmp.field]]
    name = "uptime"
    oid = "DISMAN-EVENT-MIB::sysUpTimeInstance"

  # IF-MIB::ifTable contains counters on input and output traffic as well as errors and discards.
  [[inputs.snmp.table]]
    name = "interface"
    inherit_tags = [ "hostname" ]
    oid = "IF-MIB::ifTable"

    # Interface tag - used to identify interface in metrics database
    [[inputs.snmp.table.field]]
      name = "ifDescr"
      oid = "IF-MIB::ifDescr"
      is_tag = true

  # IF-MIB::ifXTable contains newer High Capacity (HC) counters that do not overflow as fast for a few of the ifTable counters
  [[inputs.snmp.table]]
    name = "interfaceX"
    inherit_tags = [ "hostname" ]
    oid = "IF-MIB::ifXTable"

    # Interface tag - used to identify interface in metrics database
    [[inputs.snmp.table.field]]
      name = "ifDescr"
      oid = "IF-MIB::ifDescr"
      is_tag = true

  # EtherLike-MIB::dot3StatsTable contains detailed ethernet-level information about what kind of errors have been logged on an interface (such as FCS error, frame too long, etc)
  [[inputs.snmp.table]]
    name = "interface"
    inherit_tags = [ "hostname" ]
    oid = "EtherLike-MIB::dot3StatsTable"

    # Interface tag - used to identify interface in metrics database
    [[inputs.snmp.table.field]]
      name = "name"
      oid = "IF-MIB::ifDescr"
      is_tag = true
For more info about the SNMP config in telegraf. These are good links. This is the official github page. And this is the page for SNMP input plugin that explain the differences between “field” and “table”.
As well, the link below is really good too for explaining the SNMP config in telegraf:”Gathering Data via SNMP”
docker logs telegraf -f
...
2020-07-17T12:45:10Z E! [inputs.snmp] Error in plugin: initializing table interface: translating: exit status 2: MIB search path: /root/.snmp/mibs:/usr/share/snmp/mibs:/usr/share/snmp/mibs/iana:/usr/share/snmp/mibs/ietf:/usr/share/mibs/site:/usr/share/snmp/mibs:/usr/share/mibs/iana:/usr/share/mibs/ietf:/usr/share/mibs/netsnmp
Cannot find module (EtherLike-MIB): At line 0 in (none)
EtherLike-MIB::dot3StatsTable: Unknown Object Identifier
...
You will see errors about not able to find the MIB files! So I used Librenms mibs. I download the project and copied the MIBS I thought I needed (arista and some other that dont belong to a vendor). As well, this is noted by Anton’s in this link:
I have seen Grafana before but I have never used it so the configuration on queries was a bit of a challenge but I was lucky and I found very good blogs for that. The installation process is ok:
// Create folder for grafana and data
mkdir -p telemetry-example/grafana/data
cd telemetry-example/grafana

// Create docker instance
docker run -d -p 3000:3000 --name grafana \
--user root \
-v $PWD/data:/var/lib/grafana \
grafana/grafana

// Create SSL cert for grafana
docker exec -it grafana openssl req -x509 -nodes -newkey rsa:2048 -keyout /etc/ssl/grafana-selfsigned.key -out /etc/ssl/grafana-selfsigned.crt -days 365 -subj "/C=GB/ST=LDN/L=LDN/O=domain.com/CN=grafana.domain.com"

// Copy grafana config so we can update it
docker cp grafana:/etc/grafana/grafana.ini grafana.ini

// Update grafana config with SSL
vim grafana.ini
############################## Server
[server]
# Protocol (http, https, h2, socket)
protocol = https
…
# https certs & key file
cert_file = /etc/ssl/grafana-selfsigned.crt
cert_key = /etc/ssl/grafana-selfsigned.key

// Copy back the config to the container and restart
docker cp grafana.ini grafana:/etc/grafana/grafana.ini
docker container restart grafana
Now you can open in your browser to grafana “https://0.0.0.0:3000/ ” using admin/admin
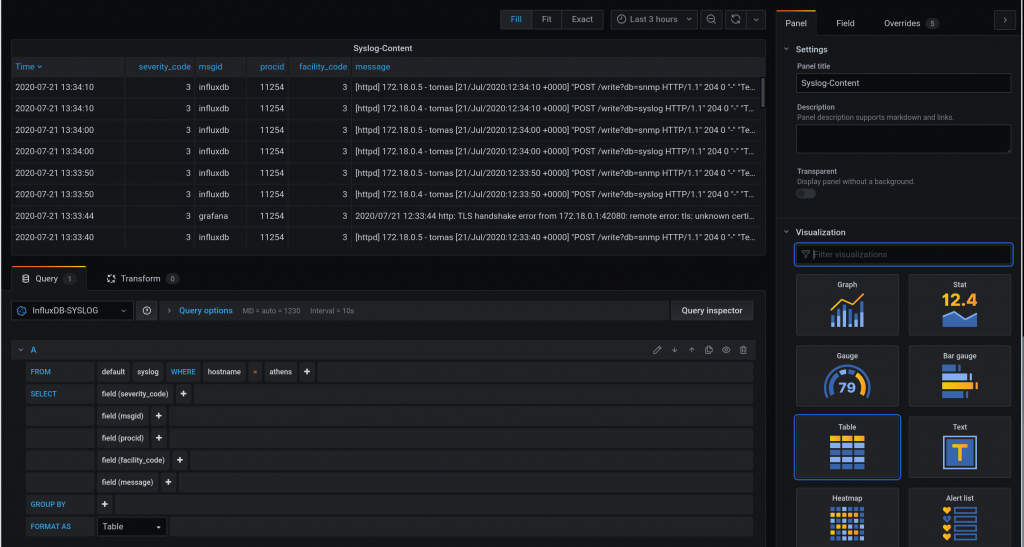
You need to add a data source that is our influxdb container. So you need to pick up the “influxdb” type and fill the values as per below.
Now, you need to create a dashboard with panel.
Links that I reviewed for creating the dasbord
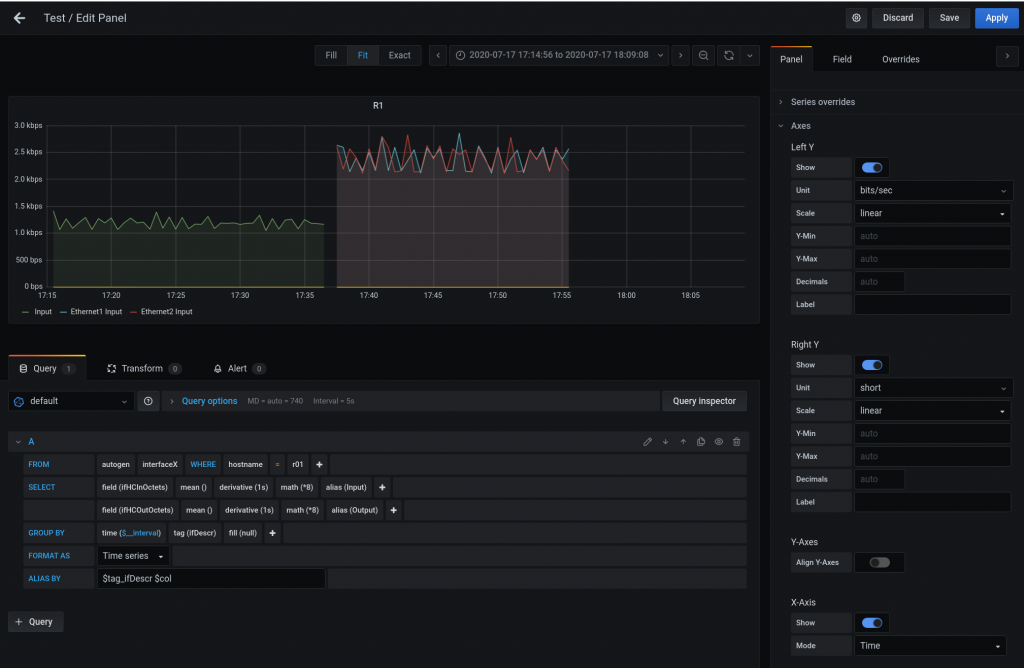
For creating a panel. The link below was the best on section “Interface Throughput”. Big thanks to the author.
BTW, you need to config SNMP in the switches so telegraf can poll it:
snmp-server location ceoslab
snmp-server community xxx123 ro
snmp-server host 172.17.0.1 version 2c xxx123
In my case, the stack of containers Influx-Telegraf-Grafana are running on the default bridge. Each container has its own IP but as the Arista containers are in the different docker network, it needs to “route” so the IP of telegraf container will be NAT-ed to 172.17.0.1 from the switches point of view.
Next
I would like to manage all this process via Ansible… Something like this.. but will take me time