I was reading this blog and realised that OOB is something is not talked about very often. Based on what I have seen in my career:
Design
You need to sell the idea that this is a must. Then you need to secure some budget. You dont need much:
1x switch
1x firewall
1x Internet access (if you have your ASN and IP range, dont use it)
Keep it simple..
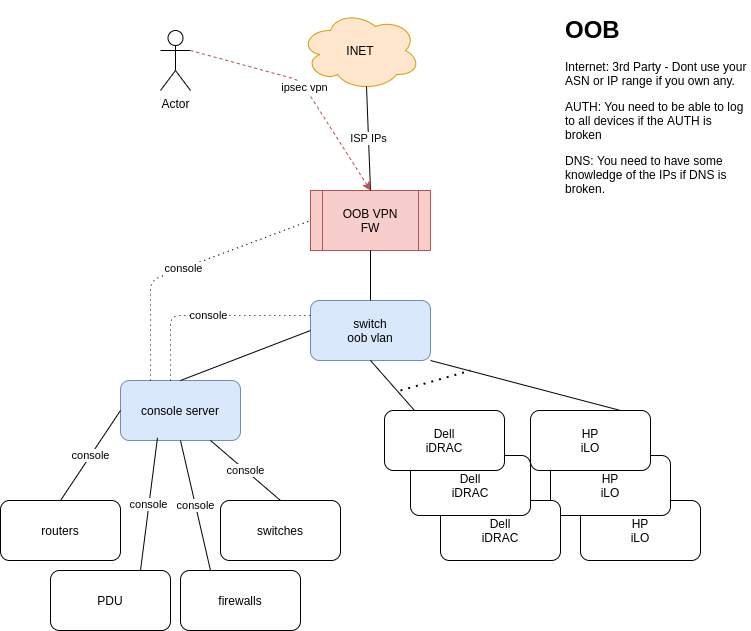
Most network kit (firewalls, routers, switches, pdus, console servers, etc) have 1xmgmt port and 1xconsole port. So all those need to go to the console server. I guess most server vendors offer some OOB access (I just know Dell and HP). So all those go to the oob switch.
If you have a massive network with hundreds of devices/servers, then you will need more oob switches and console servers. You still need just one firewall and 1 internet connection. The blog comments about the spine-leaf oob network. I guess this is the way for a massive network/DC.
Access to OOB
You need to be able to access it via your corporate network and from anywhere in the internet.
You need to be sure linux/windows/macs can VPN.
Use very strong passwords and keys.
You need to be sure the oob firewall is quite tight in access. At the end of the day you only want to allow ssh to the console server and https to the ILO/iDRACS. Nothing initiated internally can go to the internet.
Dependencies
Think in the worse scenario. Your DNS server is down. Your authentication is down.
You need to be sure you have local auth enabled in all devices for emergency
You need to work out some DNS service. Write the key IPs in the documentation?
You IP transit has to be reliable. You dont need a massive pipe but you need to be sure it is up.
Monitoring
You dont want to be in the middle of the outage and realise that your OOB is not functional. You need to be sure the ISP for the OOB is up and the devices (oob switch and oob firewall) are functional all the time.
Another point frequently lost. You need to be sure people can find info about the OOB: how is built and how to access it.
Training
At the end of the day, if you have a super OOB network but then nobody knows how to connect and use it, then it is useful. Schedule routine checkups with the team to be sure everybody can OOB. This is useful when you get a call at 3am.
Diagram
Update
Funny enough, I was watching today NLNOG live and there was a presentation about OOB with too different approaches: in-band out-of-band and pure out-of-band.
From the NTT side, I liked the comment about conserver.com to manage your serial connections. I will try to use it once I have access to a new network.
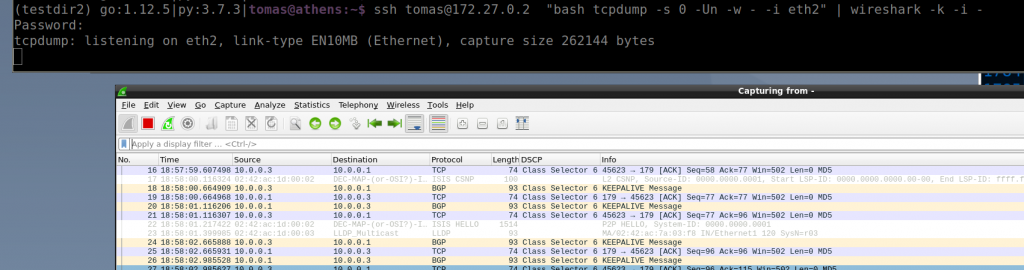
Reading this blog entry I realised that very likely I have never tried forward tcpdump to a wireshark. How many times I have taken a pcap in a switch and then I need to download to see the details in wireshark…
I guess you can find some blocking points in firewalls (at least for 2-steps option)
So I tried the single command with a switch in my ceoslab and it works!
The ssh command is actually executing the “bash tcpdump…” remotely. But the key is the “-U” and “-w -” flags. “-U” in conjunction with “-w” sends the packet without waiting for the buffer to fill. Then “-w -” says that it writes the output to stdout instead of a file. If you run the command without -U, it would work but it will update a bit slower as it needs to fill the buffers.
From tcpdump manual:
       -U
       --packet-buffered
              If the -w option is not specified, make the printed packet output ``packet-buffered''; i.e., as the description of the contents of each packet is printed, it will be written to the standard  output,  rather  than, when not writing to a terminal, being written only when the output buffer fills.

              If  the  -w  option  is  specified, make the saved raw packet output ``packet-buffered''; i.e., as each packet is saved, it will be written to the output file, rather than being written only when the output buffer fills.

              The -U flag will not be supported if tcpdump was built with an older version of libpcap that lacks the pcap_dump_flush() function.

......
   -w file
          Write the raw packets to file rather than parsing and printing them out.  They can later be printed with the -r option.  Standard output is used if file is ``-''.

          This  output will be buffered if written to a file or pipe, so a program reading from the file or pipe may not see packets for an arbitrary amount of time after they are received.  Use the -U flag to cause packets to be written as soon as they are received.
And the stdout of that process is the ssh command so we redirect that outout via a pipe “|” and it is sent as input for wireshark thanks to “-i -” that makes wireshark to read from stdin (that is the stdout from the tcpdump in the switch!)
The wireshark manual:
       -i|--interface  <capture interface>|-
           Set the name of the network interface or pipe to use for live packet capture.

           Network interface names should match one of the names listed in "wireshark -D" (described above); a number, as reported by "wireshark -D", can also be used.  If you're using UNIX, "netstat -i", "ifconfig -a" or "ip link" might also work to list interface names, although not all versions of UNIX support the -a flag to ifconfig.

           If no interface is specified, Wireshark searches the list of interfaces, choosing the first non-loopback interface if there are any non-loopback interfaces, and choosing the first loopback interface if there are no non-loopback interfaces.  If there are no interfaces at all, Wireshark reports an error and doesn't start the capture.

           Pipe names should be either the name of a FIFO (named pipe) or "-" to read data from the standard input.  On Windows systems, pipe names must be of the form "\\pipe\.\pipename".  Data read from pipes must be in standard pcapng or pcap format. Pcapng data must have the same endianness as the capturing host.

           This option can occur multiple times. When capturing from multiple interfaces, the capture file will be saved in pcapng format.

....

       -k  Start the capture session immediately.  If the -i flag was specified, the capture uses the specified interface.  Otherwise, Wireshark searches the list of interfaces, choosing the first non-loopback interface if
           there are any non-loopback interfaces, and choosing the first loopback interface if there are no non-loopback interfaces; if there are no interfaces, Wireshark reports an error and doesn't start the capture.
The two-steps option relies on “nc” to send/receive the data, but it is the same idea regarding the tcpdump/wireshark flags using “-“
$ sudo modprobe bonding
$ ip link help bond
$ sudo ip link add bond0 type bond mode 802.3ad
$ sudo ip link set eth0 master bond0
$ sudo ip link set eth1 master bond0
Bridging: vlans + trunks
ip neigh show // l2 table
ip route show // l3 table

ip route add default via 192.168.1.1 dev eth1

sudo modprobe 8021q

// create bridge and add links to bridge (switch)
sudo ip link add br0 type bridge vlan_filtering 1 // native vlan = 1
sudo ip link set eth1 master br0
sudo ip link set eth2 master br0
sudo ip link set eth3 master br0

// make eth1 access port for v11
sudo bridge vlan add dev eth1 vid 11 pvid untagged

// make eth3 access port for v12
sudo bridge vlan add dev eth3 vid 12 pvid untagged

// make eth2 trunk port for v11 and v12
sudo bridge vlan add dev eth2 vid 11
sudo bridge vlan add dev eth2 vid 12

// enable bridge and links
sudo ip link set up dev br0
sudo ip link set up dev eth1
sudo ip link set up dev eth2
sudo ip link set up dev eth3

bridge link show
bridge vlan show
bridge fdb show
VxLAN
I havent tried this yet:
Linux System 1
  sudo ip link add br0 type bridge vlan_filtering 1
  sudo ip link add vlan10 type vlan id 10 link bridge protocol none
  sudo ip addr add 10.0.0.1/24 dev vlan10
  sudo ip link add vtep10 type vxlan id 1010 local 10.1.0.1 remote 10.3.0.1 learning
  sudo ip link set eth1 master br0
  sudo bridge vlan add dev eth1 vid 10 pvid untagged

Linux System 2
  sudo ip link add br0 type bridge vlan_filtering 1
  sudo ip link add vlan10 type vlan id 10 link bridge protocol none
  sudo ip addr add 10.0.0.2/24 dev vlan10
  sudo ip link add vtep10 type vxlan id 1010 local 10.3.0.1 remote 10.1.0.1 learning
  sudo ip link set eth1 master br0
  sudo bridge vlan add dev eth1 vid 10 pvid untagged
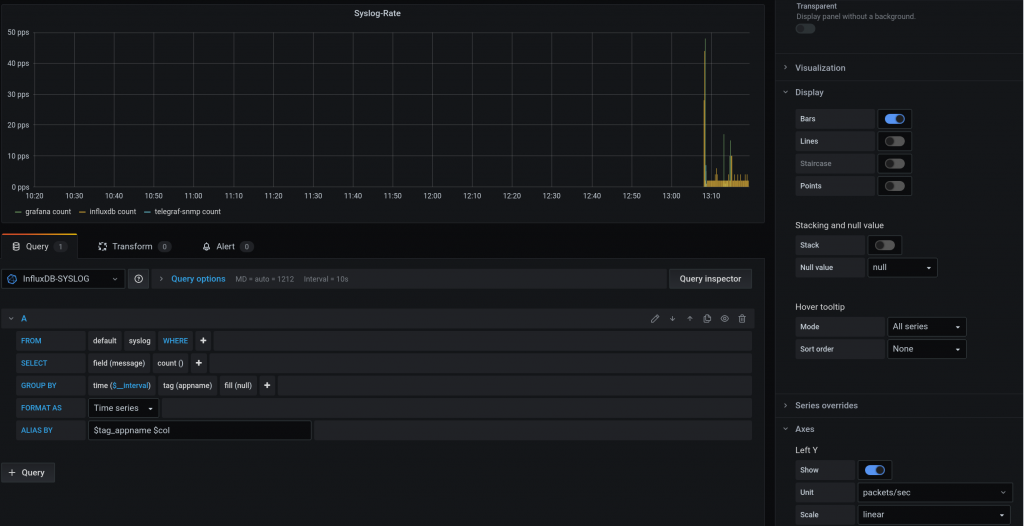
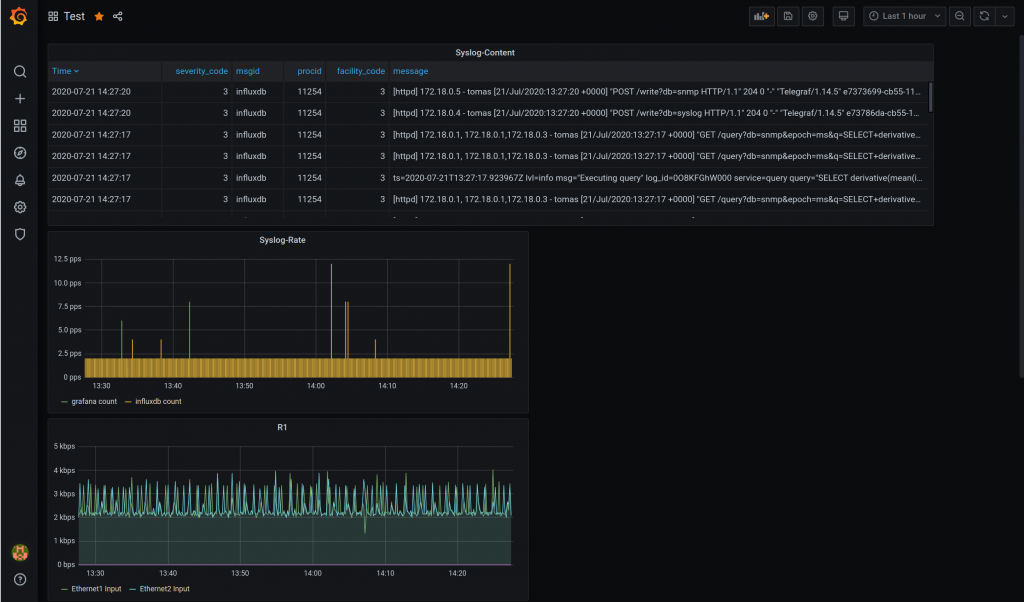
This a continuation of the last blog entry. This time we are going to gather syslog messages from the monitoring containers and it is going to be deployed by ansible!
As usual, all this is based on Anton’s Karneliuk blog post. All credits to him.
So initially we built a monitoring stack with InfluxDB, Telegraf and Grafana manually to gather and visualise SNMP infor form the Arista cEOS switches.
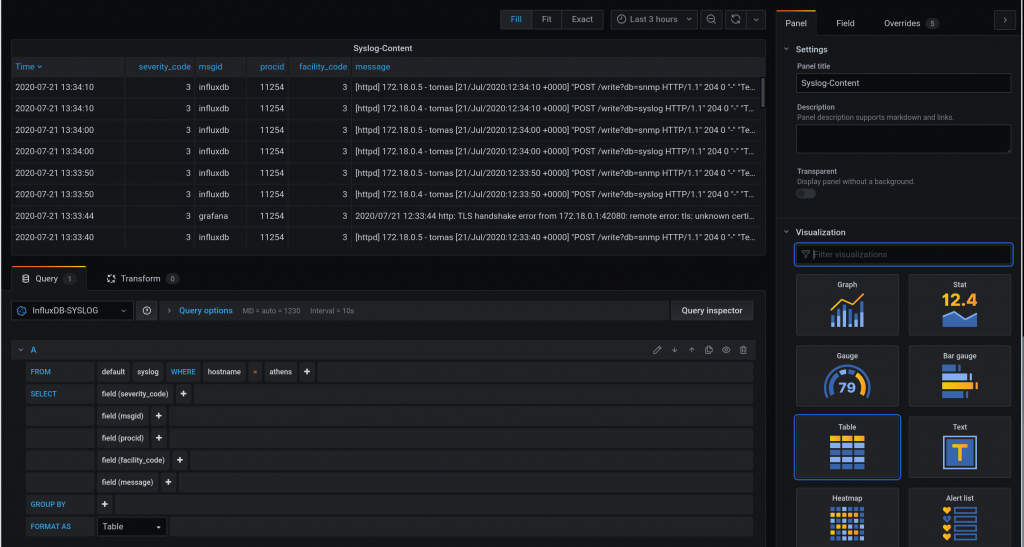
This time, we are going to send SYSLOG from the monitoring stack containers to a new Telegraf instance.
Ideally, we would like to send Syslog from the cEOS devices but as Anton mentions, the syslog rfc3164 that most network kit implements, it is not supported (yet) by telegraf, that supports rfc5424.
You can read more info about this in all these links:
The very first time, if you pay attention to the ansible logging, everything should success. If for any reason you have to make changes or troubleshoot, and execute again the full playbook, some tasks will fail, but not the playbook (this is done with ignore_errors: yes inside a task). For example, the docker network creation will fail as it is already there. The same if you try to create the user and dbs in a already running influx instance.
That playbook just calls the role “monitoring_stack“. The main playbook in that role will create the docker network where all containers will be attached, all the containers and do something hacky with iptables.
As the cEOS lab is built (using docker-topo) independently of this playbook, there are already some iptables rules in place, and somehow, when executing the role, the rules change and it blocks the new network for any outbound connectivity.
Before the iptables change in the playbook:
# iptables -t filter -S DOCKER-ISOLATION-STAGE-1
Warning: iptables-legacy tables present, use iptables-legacy to see them
-N DOCKER-ISOLATION-STAGE-1
-A DOCKER-ISOLATION-STAGE-1 -i br-4bd17cfa19a8 ! -o br-4bd17cfa19a8 -j DOCKER-ISOLATION-STAGE-2
-A DOCKER-ISOLATION-STAGE-1 -j ACCEPT
-A DOCKER-ISOLATION-STAGE-1 -i br-94c1e813ad6f ! -o br-94c1e813ad6f -j DOCKER-ISOLATION-STAGE-2
-A DOCKER-ISOLATION-STAGE-1 -i br-13ab2b6a0d1d ! -o br-13ab2b6a0d1d -j DOCKER-ISOLATION-STAGE-2
-A DOCKER-ISOLATION-STAGE-1 -i br-00db5844bbb0 ! -o br-00db5844bbb0 -j DOCKER-ISOLATION-STAGE-2
-A DOCKER-ISOLATION-STAGE-1 -i br-121978ca0282 ! -o br-121978ca0282 -j DOCKER-ISOLATION-STAGE-2
-A DOCKER-ISOLATION-STAGE-1 -i docker0 ! -o docker0 -j DOCKER-ISOLATION-STAGE-2
-A DOCKER-ISOLATION-STAGE-1 -j RETURN
#
# iptables -t filter -S DOCKER-ISOLATION-STAGE-2
Warning: iptables-legacy tables present, use iptables-legacy to see them
-N DOCKER-ISOLATION-STAGE-2
-A DOCKER-ISOLATION-STAGE-2 -o br-4bd17cfa19a8 -j DROP
-A DOCKER-ISOLATION-STAGE-2 -o br-94c1e813ad6f -j DROP
-A DOCKER-ISOLATION-STAGE-2 -o br-13ab2b6a0d1d -j DROP
-A DOCKER-ISOLATION-STAGE-2 -o br-00db5844bbb0 -j DROP
-A DOCKER-ISOLATION-STAGE-2 -o br-121978ca0282 -j DROP
-A DOCKER-ISOLATION-STAGE-2 -o docker0 -j DROP
-A DOCKER-ISOLATION-STAGE-2 -j RETURN
I want to avoid DOCKER-ISOLATION-STAGE-2 so I want the “-A DOCKER-ISOLATION-STAGE-1 -j ACCEPT” on top of that chain.
This is not the first (neither last) time that this issue bites me. I need to review carefully the docker-topo file and really get me head around the networking expectations from docker.
Another thing about docker networking that bites me very often. In my head, each monitoring has an IP. For example influxdb is 172.18.0.2 and telegraf-syslog is 172.18.0.4. We have configured influxdb to send syslog to telegraf-syslog container so I would expect the influxdb container to use its 0.2 and everything is local (no forwarding, no firewall, etc0. But not, it uses the host ip, 172.18.0.1.
Apart from that, there are several things that I had to review while adapting the role to my environment regarding docker and ansible.
docker documentation:
how to create network: https://docs.docker.com/engine/reference/commandline/network_create/
how to configure container logs: https://docs.docker.com/engine/reference/commandline/container_logs/
how to configure the logging driver in a container: https://docs.docker.com/config/containers/logging/configure/
how to configure syslog in a container: https://docs.docker.com/config/containers/logging/syslog/
how to run commands from a running container: https://docs.docker.com/engine/reference/commandline/exec/
ansible documentation:
become – run comamnds with sudo in a playbook: https://docs.ansible.com/ansible/latest/user_guide/become.html (–ask-become-pass, -K)
grafana data source module: https://docs.ansible.com/ansible/latest/modules/grafana_datasource_module.html
This is important because via ansible, I had to workout the meaning of become, how to add the syslog config in the containers and add grafana datasources via a module.