This is something I wanted to try for some time. Normally for networks monitoring you use a NMS tool. They can be expensive, free or cheap. I have seen/used Observium and LibreNMS. And many years ago Cacti. There are other tools that can do the job like Zabbix/Nagios/Icinga.
But it seems time-series-databases are the new standard. They give you more flexibility as you can create queries and graph them.
There are many tools out there that I dont really know like Prometheus, the elk-stack (Elasticsearch, Logstash, and Kibana), Influxdb, telegraf and grafana.
I decided for InfluxDB-Telegraf-Grafana stuck as I could find quickly info based on scenarios of networks.
What is the rule of eachc one:
Telegraf: collect data
InfluxDB: store data
Grafana: visualize
My main source is again Anton’s blog. All credits to him.
Environment
My network is just 3 Arista ceos containers via docker. All services will run as containers so you need docker installed. Everything is IPv4.
InfluxDB
Installation:
// Create directories
mkdir telemetry-example/influxdb
cd telemetry-example/influxdb

// Get influxdb config
docker run --rm influxdb influxd config > influxdb.conf

// Create local data folder for influxdb that we will map
mkdir data
ls -ltr

// Check docker status
docker images
docker ps -a

// Create docker instance for influxdb. Keep in  mind that I am giving a name to the instance

docker run -d -p 8086:8086 -p 8088:8088 --name influxdb \
-v $PWD/influxdb.conf:/etc/influxdb/influxdb.conf:ro \
-v $PWD/data:/var/lib/influxdb \
influxdb -config /etc/influxdb/influxdb.conf

// Verify connectivity
curl -i http://localhost:8086/ping

// Create database "test" using http-query (link below for more details)
curl -XPOST http://localhost:8086/query --data-urlencode "q=CREATE DATABASE test"
{"results":[{"statement_id":0}]} <-- command was ok!

// Create user/pass for your db.
curl -XPOST http://localhost:8086/query --data-urlencode "q=CREATE USER xxx WITH PASSWORD 'xxx123' WITH ALL PRIVILEGES"
{"results":[{"statement_id":0}]} <-- command was ok!

// Create SSL cert for influxdb
docker exec -it influxdb openssl req -x509 -nodes -newkey rsa:2048 -keyout /etc/ssl/influxdb-selfsigned.key -out /etc/ssl/influxdb-selfsigned.crt -days 365 -subj "/C=GB/ST=LDN/L=LDN/O=domain.com/CN=influxdb.domain.com"

// Update influxdb.conf for SSL
telemetry-example/influxdb$ vim influxdb.conf
…
https-enabled = true
https-certificate = "/etc/ssl/influxdb-selfsigned.crt"
https-private-key = "/etc/ssl/influxdb-selfsigned.key"
…

// Restart influxdb to take the changes
docker restart influxdb

// Get influxdb IP for using it later
docker container inspect influxdb --format='{{ .NetworkSettings.IPAddress }}'
172.17.0.2

// Verify connectivity via https
curl -i https://localhost:8086/ping --insecure
The verification for HTTPS was a bit more difficult because the result was always correct no matter what query I was running:
$ curl -G https://localhost:8086/query --data-urlencode "db=test" --data-urlencode "q=SELECT * FROM test" --insecure
{"results":[{"statement_id":0}]}

$ curl -XPOST 'https://localhost:8086/query?db=test&u=xxx&p=xxx123' --data-urlencode 'q=SELECT * FROM test' --insecure
{"results":[{"statement_id":0}]}

$ curl -XPOST 'https://localhost:8086/query?db=test&u=xxx&p=yyy1231' --data-urlencode 'q=SELECT * FROM test' --insecure
{"results":[{"statement_id":0}]}
So I decided to see if there was cli/shell for the influxdb (like in mysql, etc). And yes, there is one. Keep in mind that you have to use “-ssl -unsafeSsl” at the same time! That confused me a lot.
$ docker exec -it influxdb influx -ssl -unsafeSsl
Connected to https://localhost:8086 version 1.8.1
InfluxDB shell version: 1.8.1
> show databases
name: databases
name
_internal
test
> use test
Using database test
> show series
key
cpu,cpu=cpu-total,host=5f7aa2c5550e
Links about influxdb that are good for the docker creation and the http queries:
https://hub.docker.com/_/influxdb
https://docs.influxdata.com/influxdb/v1.7/tools/api/#query-http-endpoin
Telegraf
I struggled with the SNMP config needed in Telegraf. The installation was fine.
Links:
https://hub.docker.com/_/telegraf
https://docs.influxdata.com/telegraf/v1.14/introduction/getting-started/
Steps:
// Create dir mkdir telemetry-example/telegraf cd telemetry-example/telegraf // Get config file to be modified docker run --rm telegraf telegraf config > telegraf.conf // Add the details of influxdb in telegraf.conf. As well, you need to add the devices you want to poll. In my case 172.23.0.2/3/4. vim telegraf.conf .... [[outputs.influxdb]] urls = ["https://172.17.0.2:8086"] database = "test" skip_database_creation = false ## Timeout for HTTP messages. timeout = "5s" ## HTTP Basic Auth username = "xxx" password = "xxx123" ## Use TLS but skip chain & host verification insecure_skip_verify = true # Retrieves SNMP values from remote agents [[inputs.snmp]] ## Agent addresses to retrieve values from. ## example: agents = ["udp://127.0.0.1:161"] ## agents = ["tcp://127.0.0.1:161"]agents = ["udp://172.23.0.2:161","udp://172.23.0.3:161","udp://172.23.0.4:161"]# ## Timeout for each request.timeout = "5s"# ## SNMP version; can be 1, 2, or 3.version = 2# ## SNMP community string.community = "tomas123"# ## Number of retries to attempt.retries = 3
This is the SNMP config I added below the SNMPv3 options in [[inputs.snmp]]
#   ## Add fields and tables defining the variables you wish to collect.  This
#   ## example collects the system uptime and interface variables.  Reference the
#   ## full plugin documentation for configuration details.

  [[inputs.snmp.field]]
    name = "hostname"
    oid = "RFC1213-MIB::sysName.0"
    is_tag = true

  [[inputs.snmp.field]]
    name = "uptime"
    oid = "DISMAN-EVENT-MIB::sysUpTimeInstance"

  # IF-MIB::ifTable contains counters on input and output traffic as well as errors and discards.
  [[inputs.snmp.table]]
    name = "interface"
    inherit_tags = [ "hostname" ]
    oid = "IF-MIB::ifTable"

    # Interface tag - used to identify interface in metrics database
    [[inputs.snmp.table.field]]
      name = "ifDescr"
      oid = "IF-MIB::ifDescr"
      is_tag = true

  # IF-MIB::ifXTable contains newer High Capacity (HC) counters that do not overflow as fast for a few of the ifTable counters
  [[inputs.snmp.table]]
    name = "interfaceX"
    inherit_tags = [ "hostname" ]
    oid = "IF-MIB::ifXTable"

    # Interface tag - used to identify interface in metrics database
    [[inputs.snmp.table.field]]
      name = "ifDescr"
      oid = "IF-MIB::ifDescr"
      is_tag = true

  # EtherLike-MIB::dot3StatsTable contains detailed ethernet-level information about what kind of errors have been logged on an interface (such as FCS error, frame too long, etc)
  [[inputs.snmp.table]]
    name = "interface"
    inherit_tags = [ "hostname" ]
    oid = "EtherLike-MIB::dot3StatsTable"

    # Interface tag - used to identify interface in metrics database
    [[inputs.snmp.table.field]]
      name = "name"
      oid = "IF-MIB::ifDescr"
      is_tag = true
For more info about the SNMP config in telegraf. These are good links. This is the official github page. And this is the page for SNMP input plugin that explain the differences between “field” and “table”.
As well, the link below is really good too for explaining the SNMP config in telegraf:”Gathering Data via SNMP”
https://blog.networktocode.com/post/network_telemetry_for_snmp_devices/
Start the container:
docker run -d -p 8125:8125 -p 8092:8092 -p 8094:8094 --name telegraf \
-v $PWD/telegraf.conf:/etc/telegraf/telegraf.conf:ro \
telegraf -config /etc/telegraf/telegraf.conf
Check the logs:
docker logs telegraf -f
...
2020-07-17T12:45:10Z E! [inputs.snmp] Error in plugin: initializing table interface: translating: exit status 2: MIB search path: /root/.snmp/mibs:/usr/share/snmp/mibs:/usr/share/snmp/mibs/iana:/usr/share/snmp/mibs/ietf:/usr/share/mibs/site:/usr/share/snmp/mibs:/usr/share/mibs/iana:/usr/share/mibs/ietf:/usr/share/mibs/netsnmp
Cannot find module (EtherLike-MIB): At line 0 in (none)
EtherLike-MIB::dot3StatsTable: Unknown Object Identifier
...
You will see errors about not able to find the MIB files! So I used Librenms mibs. I download the project and copied the MIBS I thought I needed (arista and some other that dont belong to a vendor). As well, this is noted by Anton’s in this link:
https://github.com/librenms/librenms/tree/master/mibs
In my case:
/usr/share/snmp/mibs$ ls -ltr
total 4672
-rw-r--r-- 1 root root  52820 Feb  7  2019 UCD-SNMP-MIB.txt
-rw-r--r-- 1 root root  18274 Feb  7  2019 UCD-SNMP-MIB-OLD.txt
-rw-r--r-- 1 root root   8118 Feb  7  2019 UCD-IPFWACC-MIB.txt
-rw-r--r-- 1 root root   6476 Feb  7  2019 UCD-IPFILTER-MIB.txt
-rw-r--r-- 1 root root   3087 Feb  7  2019 UCD-DLMOD-MIB.txt
-rw-r--r-- 1 root root   4965 Feb  7  2019 UCD-DISKIO-MIB.txt
-rw-r--r-- 1 root root   2163 Feb  7  2019 UCD-DEMO-MIB.txt
-rw-r--r-- 1 root root   5039 Feb  7  2019 NET-SNMP-VACM-MIB.txt
-rw-r--r-- 1 root root   4814 Feb  7  2019 NET-SNMP-TC.txt
-rw-r--r-- 1 root root   1226 Feb  7  2019 NET-SNMP-SYSTEM-MIB.txt
-rw-r--r-- 1 root root   2504 Feb  7  2019 NET-SNMP-PERIODIC-NOTIFY-MIB.txt
-rw-r--r-- 1 root root   3730 Feb  7  2019 NET-SNMP-PASS-MIB.txt
-rw-r--r-- 1 root root   1215 Feb  7  2019 NET-SNMP-MONITOR-MIB.txt
-rw-r--r-- 1 root root   2036 Feb  7  2019 NET-SNMP-MIB.txt
-rw-r--r-- 1 root root   9326 Feb  7  2019 NET-SNMP-EXTEND-MIB.txt
-rw-r--r-- 1 root root   9160 Feb  7  2019 NET-SNMP-EXAMPLES-MIB.txt
-rw-r--r-- 1 root root  15901 Feb  7  2019 NET-SNMP-AGENT-MIB.txt
-rw-r--r-- 1 root root   5931 Feb  7  2019 LM-SENSORS-MIB.txt
-rw-r--r-- 1 root root   1913 Jul  2 04:38 GNOME-SMI.txt
-rw-r--r-- 1 root root   5775 Jul 17 13:14 SNMPv2-TM
-rw-r--r-- 1 root root   2501 Jul 17 13:14 SNMPv2-TC-v1
-rw-r--r-- 1 root root  38034 Jul 17 13:14 SNMPv2-TC
-rw-r--r-- 1 root root   1371 Jul 17 13:14 SNMPv2-SMI-v1
-rw-r--r-- 1 root root   8924 Jul 17 13:14 SNMPv2-SMI
-rw-r--r-- 1 root root  29305 Jul 17 13:14 SNMPv2-MIB
-rw-r--r-- 1 root root   8263 Jul 17 13:14 SNMPv2-CONF
-rw-r--r-- 1 root root  17177 Jul 17 13:14 INET-ADDRESS-MIB
-rw-r--r-- 1 root root  71691 Jul 17 13:14 IF-MIB
-rw-r--r-- 1 root root   3129 Jul 17 13:15 ARISTA-BGP4V2-TC-MIB
-rw-r--r-- 1 root root  64691 Jul 17 13:15 ARISTA-BGP4V2-MIB
-rw-r--r-- 1 root root   7155 Jul 17 13:15 ARISTA-VRF-MIB
-rw-r--r-- 1 root root   1964 Jul 17 13:15 ARISTA-SMI-MIB
-rw-r--r-- 1 root root  10901 Jul 17 13:15 ARISTA-NEXTHOP-GROUP-MIB
-rw-r--r-- 1 root root   5826 Jul 17 13:15 ARISTA-IF-MIB
-rw-r--r-- 1 root root   4547 Jul 17 13:15 ARISTA-GENERAL-MIB
-rw-r--r-- 1 root root   7014 Jul 17 13:15 ARISTA-ENTITY-SENSOR-MIB
-rw-r--r-- 1 root root  62277 Jul 17 13:21 IANA-PRINTER-MIB
-rw-r--r-- 1 root root  36816 Jul 17 13:21 IANA-MAU-MIB
-rw-r--r-- 1 root root   4299 Jul 17 13:21 IANA-LANGUAGE-MIB
-rw-r--r-- 1 root root  13954 Jul 17 13:21 IANA-ITU-ALARM-TC-MIB
-rw-r--r-- 1 root root  35628 Jul 17 13:21 IANAifType-MIB
-rw-r--r-- 1 root root  15150 Jul 17 13:21 IANA-GMPLS-TC-MIB
-rw-r--r-- 1 root root  10568 Jul 17 13:21 IANA-CHARSET-MIB
-rw-r--r-- 1 root root   4743 Jul 17 13:21 IANA-ADDRESS-FAMILY-NUMBERS-MIB
-rw-r--r-- 1 root root   3518 Jul 17 13:21 IANA-RTPROTO-MIB
-rw-r--r-- 1 root root  13100 Jul 17 13:31 ENTITY-STATE-MIB
-rw-r--r-- 1 root root  16248 Jul 17 13:31 ENTITY-SENSOR-MIB
-rw-r--r-- 1 root root  59499 Jul 17 13:31 ENTITY-MIB
-rw-r--r-- 1 root root   2114 Jul 17 13:31 BGP4V2-TC-MIB
-rw-r--r-- 1 root root  50513 Jul 17 13:31 BGP4-MIB
-rw-r--r-- 1 root root  96970 Jul 17 13:31 IEEE8021-CFMD8-MIB
-rw-r--r-- 1 root root  86455 Jul 17 13:31 IEEE8021-BRIDGE-MIB
-rw-r--r-- 1 root root 113507 Jul 17 13:31 IEEE802171-CFM-MIB
-rw-r--r-- 1 root root   6321 Jul 17 13:31 ENTITY-STATE-TC-MIB
-rw-r--r-- 1 root root 112096 Jul 17 13:31 IEEE802dot11-MIB
-rw-r--r-- 1 root root  44559 Jul 17 13:31 IEEE8023-LAG-MIB
-rw-r--r-- 1 root root  24536 Jul 17 13:31 IEEE8021-TC-MIB
-rw-r--r-- 1 root root  62182 Jul 17 13:31 IEEE8021-SECY-MIB
-rw-r--r-- 1 root root  96020 Jul 17 13:31 IEEE8021-Q-BRIDGE-MIB
-rw-r--r-- 1 root root  62591 Jul 17 13:31 IEEE8021-PAE-MIB
-rw-r--r-- 1 root root 135156 Jul 17 13:31 IEEE8021-CFM-MIB
-rw-r--r-- 1 root root  48703 Jul 17 13:31 IPV6-MIB
-rw-r--r-- 1 root root  15936 Jul 17 13:31 IPV6-ICMP-MIB
-rw-r--r-- 1 root root   3768 Jul 17 13:31 IPV6-FLOW-LABEL-MIB
-rw-r--r-- 1 root root  31323 Jul 17 13:31 IPMROUTE-STD-MIB
-rw-r--r-- 1 root root  33626 Jul 17 13:31 IPMROUTE-MIB
-rw-r--r-- 1 root root 186550 Jul 17 13:31 IP-MIB
-rw-r--r-- 1 root root  46366 Jul 17 13:31 IP-FORWARD-MIB
-rw-r--r-- 1 root root 240526 Jul 17 13:31 IEEE-802DOT17-RPR-MIB
-rw-r--r-- 1 root root   4400 Jul 17 13:31 IPV6-UDP-MIB
-rw-r--r-- 1 root root   7257 Jul 17 13:31 IPV6-TCP-MIB
-rw-r--r-- 1 root root   2367 Jul 17 13:31 IPV6-TC
-rw-r--r-- 1 root root  14758 Jul 17 13:31 IPV6-MLD-MIB
-rw-r--r-- 1 root root  69938 Jul 17 13:31 MPLS-LSR-MIB
-rw-r--r-- 1 root root  61017 Jul 17 13:31 MPLS-L3VPN-STD-MIB
-rw-r--r-- 1 root root  16414 Jul 17 13:31 LLDP-V2-TC-MIB.mib
-rw-r--r-- 1 root root  77651 Jul 17 13:31 LLDP-V2-MIB.mib
-rw-r--r-- 1 root root  76945 Jul 17 13:31 LLDP-MIB
-rw-r--r-- 1 root root  59110 Jul 17 13:31 LLDP-EXT-MED-MIB
-rw-r--r-- 1 root root  30192 Jul 17 13:31 LLDP-EXT-DOT3-MIB
-rw-r--r-- 1 root root  30182 Jul 17 13:31 LLDP-EXT-DOT1-MIB
-rw-r--r-- 1 root root  36147 Jul 17 13:31 LLDP-EXT-DCBX-MIB
-rw-r--r-- 1 root root 145796 Jul 17 13:31 ISIS-MIB
-rw-r--r-- 1 root root  28564 Jul 17 13:31 TCP-MIB
-rw-r--r-- 1 root root   1291 Jul 17 13:31 RFC-1215
-rw-r--r-- 1 root root  79667 Jul 17 13:31 RFC1213-MIB
-rw-r--r-- 1 root root   2866 Jul 17 13:31 RFC-1212
-rw-r--r-- 1 root root   3067 Jul 17 13:31 RFC1155-SMI
-rw-r--r-- 1 root root  60053 Jul 17 13:31 MPLS-VPN-MIB
-rw-r--r-- 1 root root  95418 Jul 17 13:31 MPLS-TE-STD-MIB
-rw-r--r-- 1 root root  55490 Jul 17 13:31 MPLS-TE-MIB
-rw-r--r-- 1 root root  26327 Jul 17 13:31 MPLS-TC-STD-MIB
-rw-r--r-- 1 root root  76361 Jul 17 13:31 MPLS-LSR-STD-MIB
-rw-r--r-- 1 root root  12931 Jul 17 13:31 RFC1389-MIB
-rw-r--r-- 1 root root  30091 Jul 17 13:31 RFC1284-MIB
-rw-r--r-- 1 root root 147614 Jul 17 13:31 RFC1271-MIB
-rw-r--r-- 1 root root  22342 Jul 17 13:33 SNMP-FRAMEWORK-MIB
-rw-r--r-- 1 root root 223833 Jul 17 13:33 RMON2-MIB
-rw-r--r-- 1 root root 127407 Jul 17 13:33 DIFFSERV-MIB
-rw-r--r-- 1 root root 101324 Jul 17 13:34 TOKEN-RING-RMON-MIB
-rw-r--r-- 1 root root 147822 Jul 17 13:34 RMON-MIB
-rw-r--r-- 1 root root  26750 Jul 17 13:34 INTEGRATED-SERVICES-MIB
-rw-r--r-- 1 root root   1863 Jul 17 13:34 DIFFSERV-DSCP-TC
-rw-r--r-- 1 root root  34162 Jul 17 13:34 SNMP-VIEW-BASED-ACM-MIB
-rw-r--r-- 1 root root  84133 Jul 17 13:34 Q-BRIDGE-MIB
-rw-r--r-- 1 root root  16414 Jul 17 13:34 TRANSPORT-ADDRESS-MIB
-rw-r--r-- 1 root root  39879 Jul 17 13:35 P-BRIDGE-MIB
-rw-r--r-- 1 root root   4660 Jul 17 13:35 HCNUM-TC
-rw-r--r-- 1 root root  54884 Jul 17 13:35 BRIDGE-MIB
-rw-r--r-- 1 root root   2628 Jul 17 13:35 VPN-TC-STD-MIB
-rw-r--r-- 1 root root  10575 Jul 17 13:35 HC-PerfHist-TC-MIB
-rw-r--r-- 1 root root  22769 Jul 17 13:50 SNMP-TARGET-MIB
-rw-r--r-- 1 root root  84492 Jul 17 13:54 EtherLike-MIB
-rw-r--r-- 1 root root  68177 Jul 17 13:56 DISMAN-EXPRESSION-MIB
Once you have the MIB files, you need to copy across to the telegraf container:
docker cp /usr/share/snmp/mibs/. telegraf:/usr/share/snmp/mibs/
docker restart telegraf
These two links helped me a lot to troubleshoot and understand snmpwalk:
https://www.dev-eth0.de/2016/12/06/grafana_snmp/
If you dont want to see the OIDS in snmpwalk, you need to load all your MIBS with -m ALL
/usr/share/snmp/mibs$ snmpwalk -Os -v2c -c community -m ALL 172.23.0.2 | head -10
sysDescr.0 = STRING: Linux r01 5.7.0-1-amd64 #1 SMP Debian 5.7.6-1 (2020-06-24) x86_64
sysObjectID.0 = OID: aristaProducts.2600
sysUpTimeInstance = Timeticks: (2503676) 6:57:16.76
sysContact.0 = STRING:
sysName.0 = STRING: r01
sysLocation.0 = STRING: ceoslab
sysServices.0 = INTEGER: 14
sysORLastChange.0 = Timeticks: (35427) 0:05:54.27
sysORID.1 = OID: tcpMIB
sysORID.2 = OID: mib-2.50

$ snmpwalk -v2c -c community -m ALL 172.23.0.2 | head -10
SNMPv2-MIB::sysDescr.0 = STRING: Linux r01 5.7.0-1-amd64 #1 SMP Debian 5.7.6-1 (2020-06-24) x86_64
SNMPv2-MIB::sysObjectID.0 = OID: ARISTA-SMI-MIB::aristaProducts.2600
DISMAN-EVENT-MIB::sysUpTimeInstance = Timeticks: (2535736) 7:02:37.36
SNMPv2-MIB::sysContact.0 = STRING:
SNMPv2-MIB::sysName.0 = STRING: r01
SNMPv2-MIB::sysLocation.0 = STRING: ceoslab
SNMPv2-MIB::sysServices.0 = INTEGER: 14
SNMPv2-MIB::sysORLastChange.0 = Timeticks: (35427) 0:05:54.27
SNMPv2-MIB::sysORID.1 = OID: TCP-MIB::tcpMIB
SNMPv2-MIB::sysORID.2 = OID: SNMPv2-SMI::mib-2.50

/usr/share/snmp/mibs$ snmpwalk -Os -v2c -c community 172.23.0.2 | head -10
iso.3.6.1.2.1.1.1.0 = STRING: "Linux r01 5.7.0-1-amd64 #1 SMP Debian 5.7.6-1 (2020-06-24) x86_64"
iso.3.6.1.2.1.1.2.0 = OID: iso.3.6.1.4.1.30065.1.2600
iso.3.6.1.2.1.1.3.0 = Timeticks: (2505381) 6:57:33.81
iso.3.6.1.2.1.1.4.0 = ""
iso.3.6.1.2.1.1.5.0 = STRING: "r01"
iso.3.6.1.2.1.1.6.0 = STRING: "ceoslab"
iso.3.6.1.2.1.1.7.0 = INTEGER: 14
iso.3.6.1.2.1.1.8.0 = Timeticks: (35427) 0:05:54.27
iso.3.6.1.2.1.1.9.1.2.1 = OID: iso.3.6.1.2.1.49
iso.3.6.1.2.1.1.9.1.2.2 = OID: iso.3.6.1.2.1.50
And if you want to verify that telegraf is capable to use the MIBS:
docker exec -it telegraf snmpwalk -Os -v2c -c community -m ALL 172.23.0.2 | head -10
Now, you can check if telegraf is updating influxdb. If there is output, it is good!
$ curl -G 'https://localhost:8086/query?db=test&pretty=true&u=xxx&p=xxx123' --data-urlencode "q=SELECT * FROM interfaceX limit 2" --insecure
{
"results": [
{
"statement_id": 0,
"series": [
{
"name": "interfaceX",
"columns": [
"time",
"agent_host",
"host",
"hostname",
"ifAlias",
"ifConnectorPresent",
"ifCounterDiscontinuityTime",
"ifDescr",
"ifHCInBroadcastPkts",
"ifHCInMulticastPkts",
"ifHCInOctets",
"ifHCInUcastPkts",
"ifHCOutBroadcastPkts",
"ifHCOutMulticastPkts",
"ifHCOutOctets",
"ifHCOutUcastPkts",
"ifHighSpeed",
"ifInBroadcastPkts",
"ifInMulticastPkts",
"ifLinkUpDownTrapEnable",
"ifName",
"ifOutBroadcastPkts",
"ifOutMulticastPkts",
"ifPromiscuousMode",
"name"
],
"values": [
[
"2020-07-17T13:00:10Z",
"172.23.0.2",
"6778bdf4ea85",
"r01",
null,
1,
0,
"Ethernet1",
0,
2118,
2013125,
7824,
0,
0,
0,
0,
0,
0,
2118,
1,
"Ethernet1",
0,
0,
2,
null
],
[
"2020-07-17T13:00:10Z",
"172.23.0.2",
"6778bdf4ea85",
"r01",
"CORE Loopback",
2,
0,
"Loopback1",
0,
0,
0,
0,
0,
0,
0,
0,
0,
0,
0,
1,
"Loopback1",
0,
0,
2,
null
]
]
}
]
}
]
}
Grafana
I have seen Grafana before but I have never used it so the configuration on queries was a bit of a challenge but I was lucky and I found very good blogs for that. The installation process is ok:
// Create folder for grafana and data
mkdir -p telemetry-example/grafana/data
cd telemetry-example/grafana

// Create docker instance
docker run -d -p 3000:3000 --name grafana \
--user root \
-v $PWD/data:/var/lib/grafana \
grafana/grafana

// Create SSL cert for grafana
docker exec -it grafana openssl req -x509 -nodes -newkey rsa:2048 -keyout /etc/ssl/grafana-selfsigned.key -out /etc/ssl/grafana-selfsigned.crt -days 365 -subj "/C=GB/ST=LDN/L=LDN/O=domain.com/CN=grafana.domain.com"

// Copy grafana config so we can update it
docker cp grafana:/etc/grafana/grafana.ini grafana.ini

// Update grafana config with SSL
vim grafana.ini
############################## Server
[server]
# Protocol (http, https, h2, socket)
protocol = https
…
# https certs & key file
cert_file = /etc/ssl/grafana-selfsigned.crt
cert_key = /etc/ssl/grafana-selfsigned.key

// Copy back the config to the container and restart
docker cp grafana.ini grafana:/etc/grafana/grafana.ini
docker container restart grafana
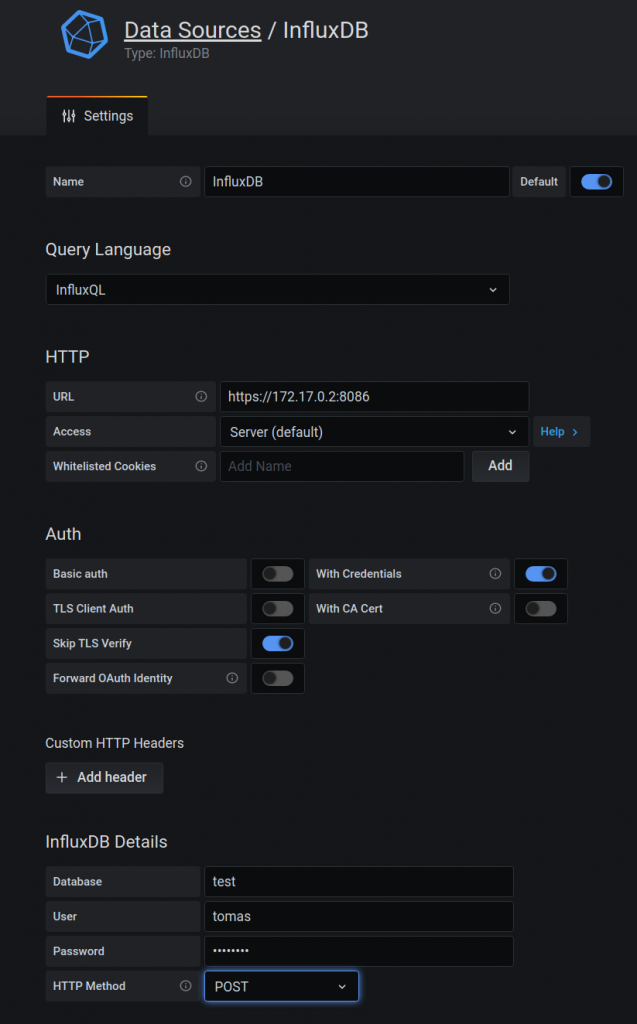
Now you can open in your browser to grafana “https://0.0.0.0:3000/ ” using admin/admin
You need to add a data source that is our influxdb container. So you need to pick up the “influxdb” type and fill the values as per below.
Now, you need to create a dashboard with panel.
Links that I reviewed for creating the dasbord
For creating a panel. The link below was the best on section “Interface Throughput”. Big thanks to the author.
https://lkhill.com/telegraf-influx-grafana-network-stats/
This is my query for checking all details:
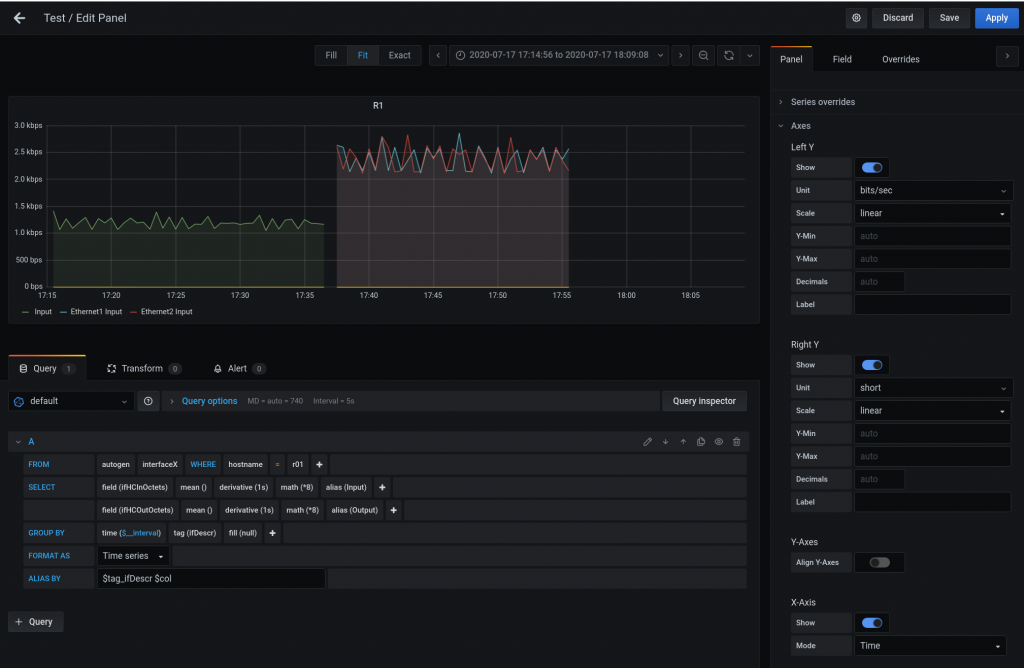
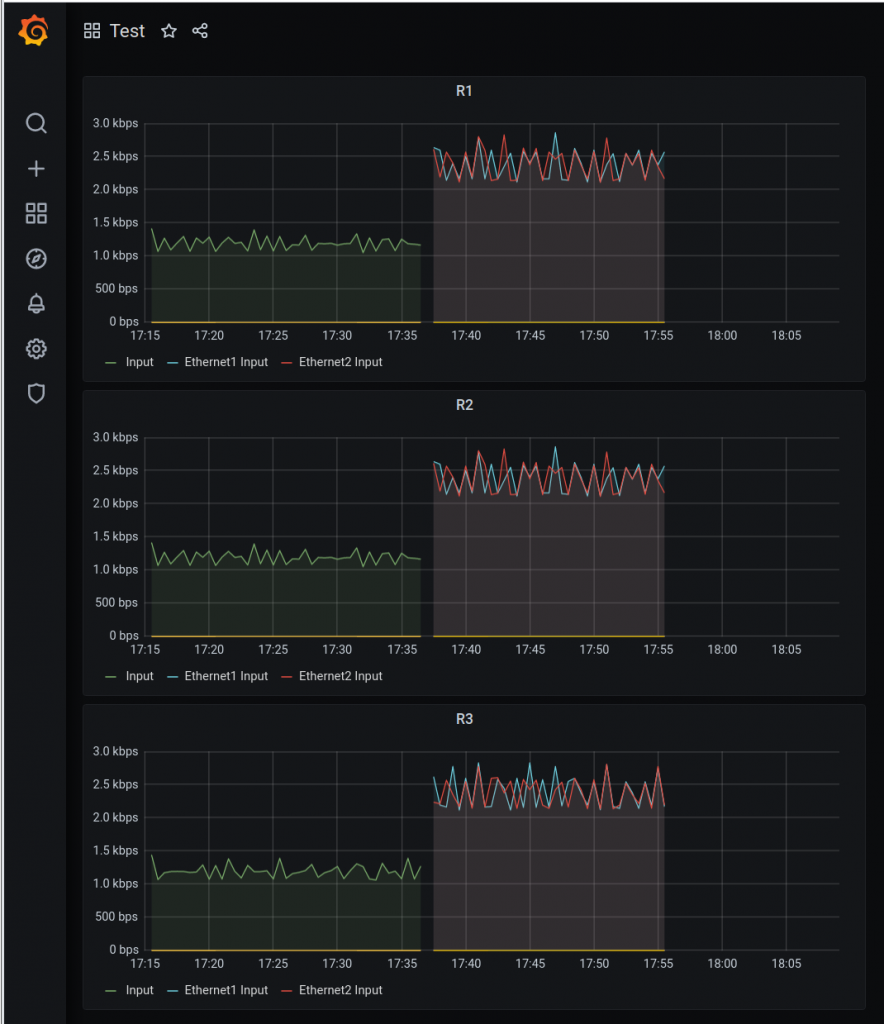
And this is my final dashboard.
SNMP Config
BTW, you need to config SNMP in the switches so telegraf can poll it:
snmp-server location ceoslab
snmp-server community xxx123 ro
snmp-server host 172.17.0.1 version 2c xxx123
In my case, the stack of containers Influx-Telegraf-Grafana are running on the default bridge. Each container has its own IP but as the Arista containers are in the different docker network, it needs to “route” so the IP of telegraf container will be NAT-ed to 172.17.0.1 from the switches point of view.
Next
I would like to manage all this process via Ansible… Something like this.. but will take me time
Notes
As usual, I have struggled but I have learned a lot and at the end things are working. I am happy with that.