One thing I wanted to get my hands dirty is telemetry. I found this blog post from Arista and I have tried to use it for vEOS.
As per the blog, I had to install go and docker in my VM (debian) on GCP.
Installed docker via aptitude:
# aptitude install docker.io
# aptitude install docker-compose
# aptitude install telnet
Installed golang via updating .bashrc
########################
# Go configuration
########################
#
# git clone -b v0.0.4 https://github.com/wfarr/goenv.git $HOME/.goenv
if [ ! -d "$HOME/.goenv" ]; then
    git clone https://github.com/syndbg/goenv.git $HOME/.goenv
fi
#export GOPATH="$HOME/storage/golang/go"
#export GOBIN="$HOME/storage/golang/go/bin"
#export PATH="$GOPATH/bin:$PATH"
if [ -d "$HOME/.goenv"   ]
then
    export GOENV_ROOT="$HOME/.goenv"
    export PATH="$GOENV_ROOT/bin:$PATH"
    if  type "goenv" &> /dev/null; then
        eval "$(goenv init -)"
        # Add the version to my prompt
        __goversion (){
            if  type "goenv" &> /dev/null; then
                goenv_go_version=$(goenv version | sed -e 's/ .*//')
                printf $goenv_go_version
            fi
        }
        export PS1="go:\$(__goversion)|$PS1"
        export PATH="$GOROOT/bin:$PATH"
        export PATH="$PATH:$GOPATH/bin"
    fi
fi

################## End GoLang #####################
Then started a new bash session to trigger the installation of goenv and then install a go version
$ goenv install 1.14.6
$ goenv global 1.14.6
Now we can start the docker containers for influx and grafana:
mkdir telemetry
cd telemetry
mkdir influxdb_data
mkdir grafana_data

cat docker-compose.yaml
version: "3"

services:
 influxdb:
   container_name: influxdb-tele
   environment:
     INFLUXDB_DB: grpc
     INFLUXDB_ADMIN_USER: "admin"
     INFLUXDB_ADMIN_PASSWORD: "arista"
     INFLUXDB_USER: tac
     INFLUXDB_USER_PASSWORD: arista
     INFLUXDB_RETENTION_ENABLED: "false"
     INFLUXDB_OPENTSDB_0_ENABLED: "true"
     INFLUXDB_OPENTSDB_BIND_ADDRESS: ":4242"
     INFLUXDB_OPENTSDB_DATABASE: "grpc"
   ports:
     - '8086:8086'
     - '4242:4242'
     - '8083:8083'
   networks:
     - monitoring
   volumes:
     - influxdb_data:/var/lib/influxdb
   command:
     - '-config'
     - '/etc/influxdb/influxdb.conf'
   image: influxdb:latest
   restart: always

 grafana:
   container_name: grafana-tele
   environment:
     GF_SECURITY_ADMIN_USER: admin
     GF_SECURITY_ADMIN_PASSWORD: arista
   ports:
     - '3000:3000'
   networks:
     - monitoring
   volumes:
     - grafana_data:/var/lib/grafana
   image: grafana/grafana
   restart: always

networks:
 monitoring:

volumes:
 influxdb_data: {}
 grafana_data: {}
Now we should be able to start the containers:
sudo docker-compose up -d    // start containers
sudo docker-compose down -v  // for stopping containers

sudo docker ps -a
CONTAINER ID IMAGE COMMAND CREATED STATUS PORTS NAMES
cad339ead2ee influxdb:latest "/entrypoint.sh -con…" 5 hours ago Up 5 hours 0.0.0.0:4242->4242/tcp, 0.0.0.0:8083->8083/tcp, 0.0.0.0:8086->8086/tcp influxdb-tele
ef88acc47ee3 grafana/grafana "/run.sh" 5 hours ago Up 5 hours 0.0.0.0:3000->3000/tcp grafana-tele

sudo docker network ls
NETWORK ID NAME DRIVER SCOPE
fe19e7876636 bridge bridge local
0a8770578f3f host host local
6e128a7682f1 none null local
3d27d0ed3ab3 telemetry_monitoring bridge local

sudo docker network inspect telemetry_monitoring
[
{
"Name": "telemetry_monitoring",
"Id": "3d27d0ed3ab3b0530441206a128d849434a540f8e5a2c109ee368b01052ed418",
"Created": "2020-08-12T11:22:03.05783331Z",
"Scope": "local",
"Driver": "bridge",
"EnableIPv6": false,
"IPAM": {
"Driver": "default",
"Options": null,
"Config": [
{
"Subnet": "172.18.0.0/16",
"Gateway": "172.18.0.1"
}
]
},
"Internal": false,
"Attachable": true,
"Ingress": false,
"ConfigFrom": {
"Network": ""
},
"ConfigOnly": false,
"Containers": {
"cad339ead2eeb0b479bd6aa024cb2150fb1643a0a4a59e7729bb5ddf088eba19": {
"Name": "influxdb-tele",
"EndpointID": "e3c7f853766ed8afe6617c8fac358b3302de41f8aeab53d429ffd1a28b6df668",
"MacAddress": "02:42:ac:12:00:03",
"IPv4Address": "172.18.0.3/16",
"IPv6Address": ""
},
"ef88acc47ee30667768c5af9bbd70b95903d3690c4d80b83ba774b298665d15d": {
"Name": "grafana-tele",
"EndpointID": "3fe2b424cbb66a93e9e06f4bcc2e7353a0b40b2d56777c8fee8726c96c97229a",
"MacAddress": "02:42:ac:12:00:02",
"IPv4Address": "172.18.0.2/16",
"IPv6Address": ""
}
},
"Options": {},
"Labels": {
"com.docker.compose.network": "monitoring",
"com.docker.compose.project": "telemetry"
}
}
]
Now we have to generate the octsdb binary and copy it to the switches as per instructions
$ go get github.com/aristanetworks/goarista/cmd/octsdb
$ cd $GOPATH/src/github.com/aristanetworks/goarista/cmd/octsdb

$ GOOS=linux GOARCH=386 go build   // I used this one
$ GOOS=linux GOARCH=amd64 go build // if you use EOS 64 Bits

$ scp octsdb user@SWITCH_IP:/mnt/flash/
An important thing is the configuration file for octsdb. I struggled trying to get a config file that provided me CPU and interface counters. All the examples are based on hardware platforms but I am using containers/VMs. But using this other blog post, I worked out the path for the interfaces in vEOS.
This is what I see in vEOS:
bash-4.2# curl localhost:6060/rest/Smash/counters/ethIntf/EtbaDut/current
{
    "counter": {
        "Ethernet1": {
            "counterRefreshTime": 0,
            "ethStatistics": {
...

bash-4.2# curl localhost:6060/rest/Kernel/proc/cpu/utilization/cpu/0
{
    "idle": 293338,
    "name": "0",
    "nice": 2965,
    "system": 1157399,
    "user": 353004,
    "util": 100
}
And this is what I see in cEOS. It seems this is not functional:
bash-4.2# curl localhost:6060/rest/Smash/counters/ethIntf
curl: (7) Failed to connect to localhost port 6060: Connection refused
bash-4.2#
bash-4.2#
bash-4.2# curl localhost:6060/rest/Kernel/proc/cpu/utilization/cpu/0
curl: (7) Failed to connect to localhost port 6060: Connection refused
bash-4.2#
This is the file I have used and pushed to the switches:
$ cat veos4.23.json
{
	"comment": "This is a sample configuration for vEOS 4.23",
	"subscriptions": [
		"/Smash/counters/ethIntf",
		"/Kernel/proc/cpu/utilization"
	],
	"metricPrefix": "eos",
	"metrics": {
		"intfCounter": {
			"path": "/Smash/counters/ethIntf/EtbaDut/current/(counter)/(?P<intf>.+)/statistics/(?P<direction>(?:in|out))(Octets|Errors|Discards)"
		},
		"intfPktCounter": {
			"path": "/Smash/counters/ethIntf/EtbaDut/current/(counter)/(?P<intf>.+)/statistics/(?P<direction>(?:in|out))(?P<type>(?:Ucast|Multicast|Broadcast))(Pkt)"
		},
                "totalCpu": {
                        "path": "/Kernel/proc/(cpu)/(utilization)/(total)/(?P<type>.+)"
                },
                "coreCpu": {
                        "path": "/Kernel/proc/(cpu)/(utilization)/(.+)/(?P<type>.+)"
                }
	}
}
$ scp veos4.23.json r1:/mnt/flash
Now you have to configure the switch to generate and send the data. In my case, I am using the MGMT vrf.
!
daemon TerminAttr
   exec /usr/bin/TerminAttr -disableaaa -grpcaddr MGMT/0.0.0.0:6042
   no shutdown
!
daemon octsdb
   exec /sbin/ip netns exec ns-MGMT /mnt/flash/octsdb -addr 192.168.249.4:6042 -config /mnt/flash/veos4.23.json -tsdb 10.128.0.4:4242
   no shutdown
!
TermiAttr it is listening on 0.0.0.0:6042. “octsdb” is using the mgmt IP 192.168.249.4 (that is in MGMT vrf) to connect to the influxdb container that is running in 10.128.0.4:4242
Verify that things are running:
# From the switch
show agent octsdb log

# From InfluxDB container
$ sudo docker exec -it influxdb-tele bash
root@cad339ead2ee:/# influx -precision 'rfc3339'
Connected to http://localhost:8086 version 1.8.1
InfluxDB shell version: 1.8.1
> show databases
name: databases
name
----
grpc
_internal
> use grpc
Using database grpc
> show measurements
name: measurements
name
----
eos.corecpu.cpu.utilization._counts
eos.corecpu.cpu.utilization.cpu.0
eos.corecpu.cpu.utilization.total
eos.intfcounter.counter.discards
eos.intfcounter.counter.errors
eos.intfcounter.counter.octets
eos.intfpktcounter.counter.pkt
eos.totalcpu.cpu.utilization.total
> exit
root@cad339ead2ee:/# exit
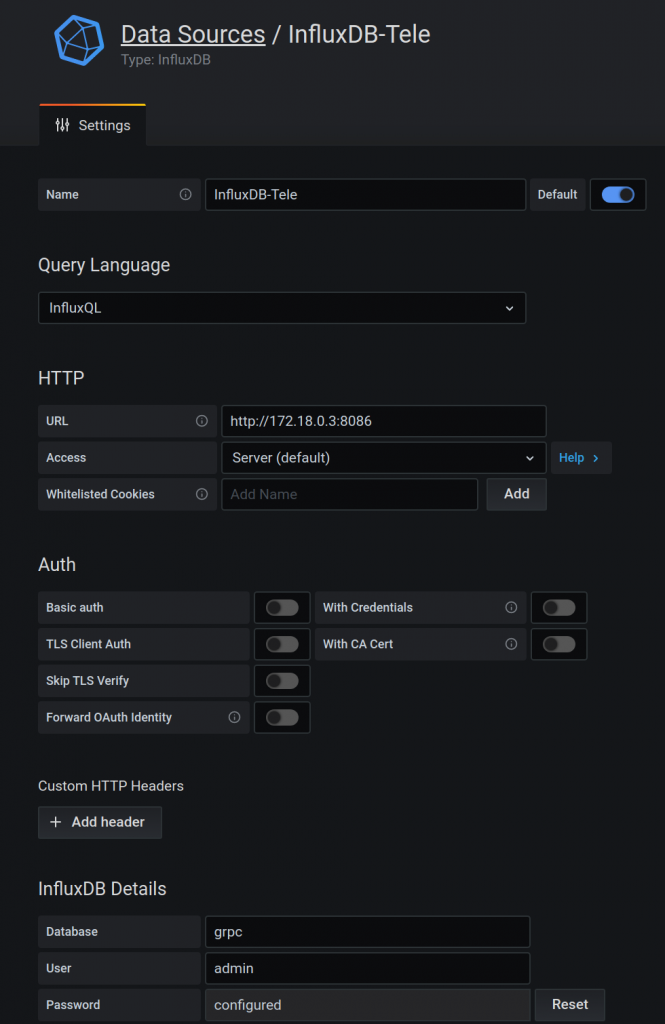
Now we need to configure grafana. So first we create a connection to influxdb. Again, I struggled with the URL. Influx and grafana are two containers running in the same host. I was using initially localhost and it was failing. At the end I had to find out the IP assigned to the influxdb container and use it.
Now you can create a dashboard with panels.
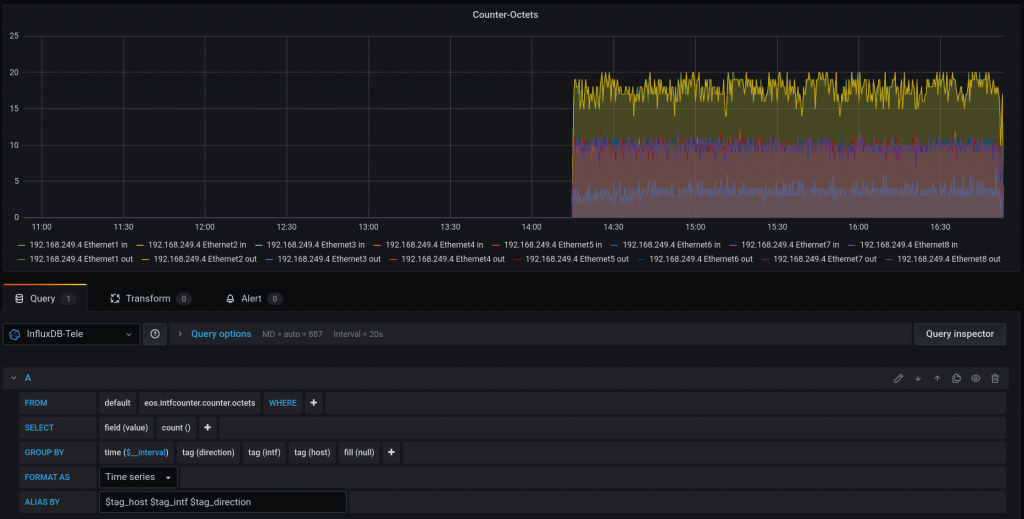
For octet counters:
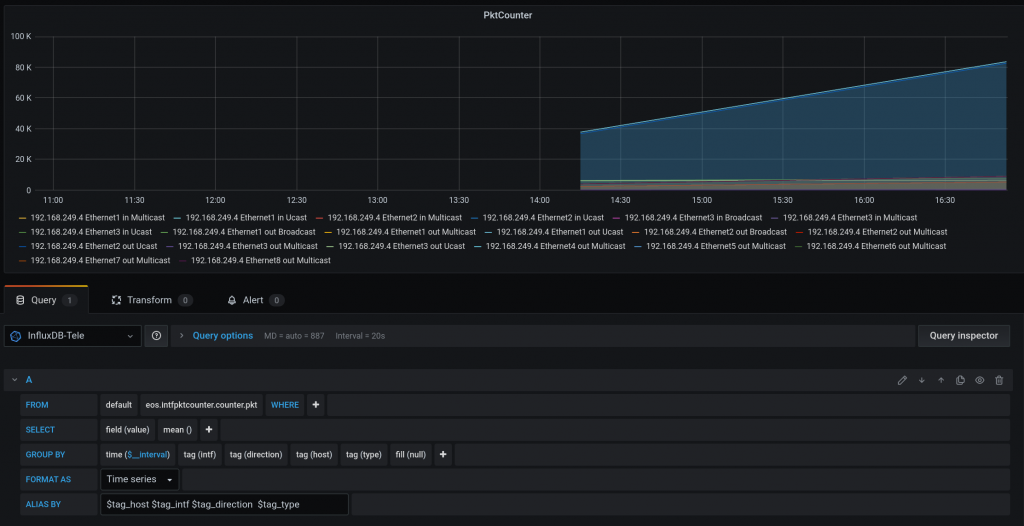
For packet types:
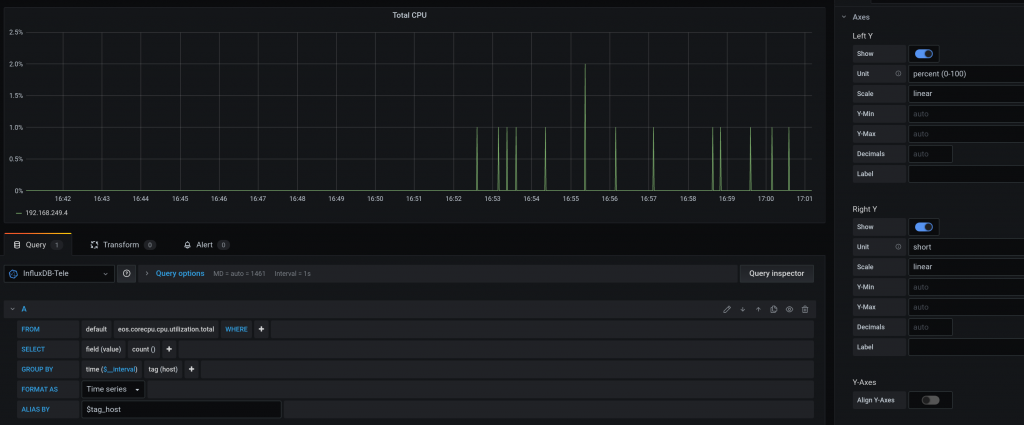
For CPU usage:
And this is the dashboard:
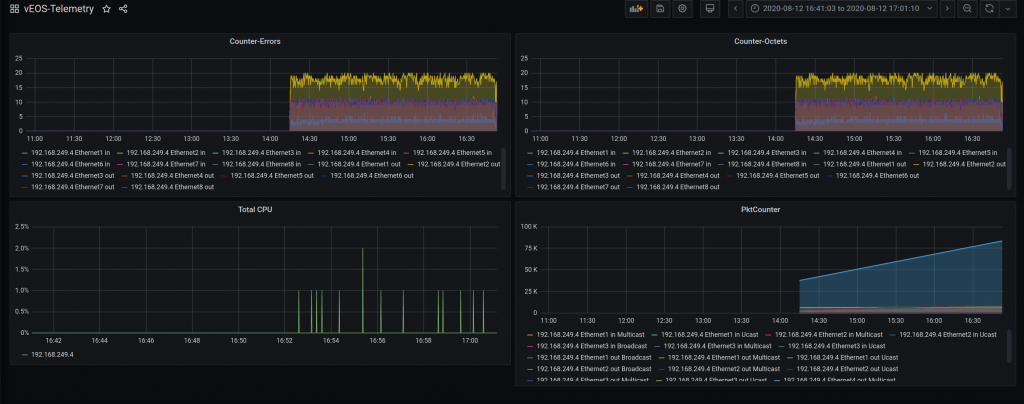
Keep in mind that I am not 100% sure my grafana panels are correct for CPU and Counters (PktCounter makes sense)
At some point, I want to try telemetry for LANZ via this telerista plugin.