As my last attempt to build a MPLS-SR Arista lab failed usin cEOS. I decided to try a different approach as I need more resources that my laptop has. For sometime, I wanted to use tesuto but I am not sure if it is still on business. From the main page, you can’t find any link to register (and pay) for the service. Although if you search for “pricing” you can find a link to that. That’s it.
The other option was to use EVE-NG. You can use it in your own bare-metal server or in the cloud.
So finally, I decided to spend some money. I signed up for GCP with a $300 free computing offer. So at least I dont pay for GCP yet and then I bought one year of EVE-NG professional. Let’s see how it goes.
Before buying the license, you need to install eve-ng. So I followed the official documentation to use it in GCP as it is quite up to date.
I consulted other links too just to compare other users experiences like these:
https://github.com/NetDevNotes/Eve-NG-in-Google-Cloud
I had an issue during the process. When I had to configure DHCP, the IP wizard was showing garbage in the script. Hopefully I didnt have to add anything just accept all default values.
So once it is done, you need to https to the VM…. it didnt work. Somehow “apache” was started. So after startup, got access. I can login and change the default password.
root@eveng01:/var/www/html# service apache2 start
root@eveng01:/var/www/html# service apache2 status
So far, I am not planning to give it a static IP to the VM and a FQDN from my domain. Maybe in the future if I use it often.
Now, I need to create the Arista lab. I followed one of the links earlier, it was quite handy.
I created my small 3 nodes lab, apply the config. All this with a couple of reboots in each device and you have the lab up and running!
It is nice to work in a system with plenty of RAM. The VM has 60GB of RAM and 16vCPU. So I should be able to create a lab with 14 vEOS (each one needs 4GB and 1CPU).
$ top
top - 13:00:27 up 1:33, 1 user, load average: 2.12, 1.37, 1.04
Tasks: 266 total, 1 running, 168 sleeping, 0 stopped, 0 zombie
%Cpu(s): 10.3 us, 5.9 sy, 0.0 ni, 83.4 id, 0.0 wa, 0.0 hi, 0.4 si, 0.0 st
KiB Mem : 10.2/61838576 [ ]
KiB Swap: 0.0/0 [ ]
PID USER PR NI VIRT RES SHR S %CPU %MEM TIME+ COMMAND
27623 root 20 0 3034100 1.992g 25696 S 100.4 3.4 11:21.40 qemu-system-x86
26120 root 20 0 3034100 1.951g 26068 S 100.0 3.3 8:54.66 qemu-system-x86
24536 root 20 0 3034100 1.915g 26072 S 43.3 3.2 9:16.11 qemu-system-x86
245 root 25 5 0 0 0 S 8.2 0.0 2:05.36 uksmd
7500 www-data 20 0 377908 30744 12732 S 4.5 0.0 0:17.27 apache2
4262 root 20 0 1138416 15732 13508 S 0.8 0.0 0:25.40 janus
5526 tomcat8 20 0 5925452 348168 17676 S 0.8 0.6 0:43.17 java
159 root 20 0 0 0 0 I 0.4 0.0 0:01.13 kworker/6:1-eve
4363 mysql 20 0 2493932 85712 20408 S 0.4 0.1 0:10.80 mysqld
7210 www-data 20 0 377900 31024 12724 S 0.4 0.1 0:07.08 apache2
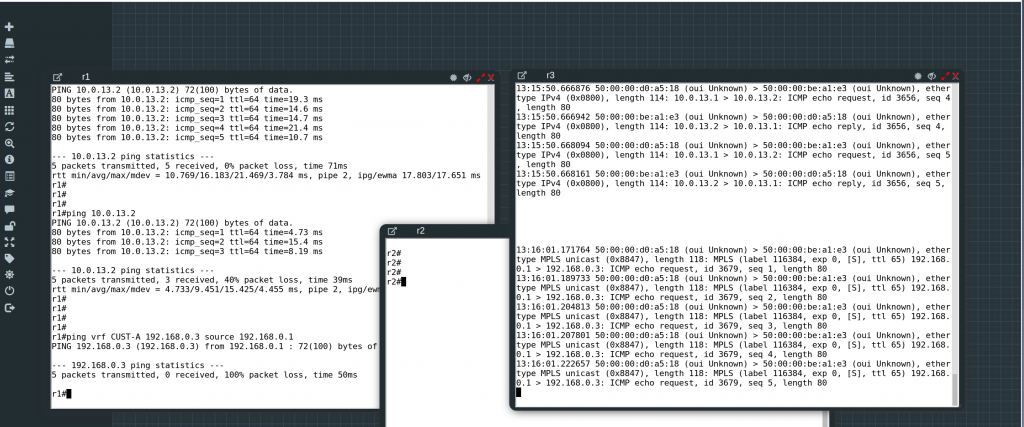
Unfortunately, I am hitting the same problem, and this time, the MAC addresses are the ones you expect to see based on the interface outputs:
I have asked again Arista if this is expected…
In the main time, I need to learn how to map the devices in the VM to external ports so I can access directly from my laptop.
UPDATE
My Arista SE confirmed that cEOS doesnt support MPLS Data Plane. And this should work with vEOS. So I asked in Arista forum about this problem with vEOS and turns out that this works but you need to be sure that a “physical” interface is attached to the VRF, a Loopback or SVI is not enough.
This seems to be the original post about the problem:
https://eos.arista.com/forum/see-bgp-routes-unable-to-ping/
So I just added a VPC to et3 in each device in CUST-A VRF and I can ping across VRFs!!!
r4#ping vrf CUST-A 192.168.0.2 source 192.168.0.1
PING 192.168.0.2 (192.168.0.2) from 192.168.0.1 : 72(100) bytes of data.
80 bytes from 192.168.0.2: icmp_seq=1 ttl=65 time=70.9 ms
80 bytes from 192.168.0.2: icmp_seq=2 ttl=65 time=64.3 ms
80 bytes from 192.168.0.2: icmp_seq=3 ttl=65 time=58.2 ms
80 bytes from 192.168.0.2: icmp_seq=4 ttl=65 time=50.6 ms
80 bytes from 192.168.0.2: icmp_seq=5 ttl=65 time=58.6 ms
--- 192.168.0.2 ping statistics ---
5 packets transmitted, 5 received, 0% packet loss, time 47ms
rtt min/avg/max/mdev = 50.613/60.554/70.943/6.786 ms, pipe 5, ipg/ewma 11.817/65.414 ms
r4#
And the funny thing. I can’t see anymore the MPLS packets in the tcpdump 🙂
Anyway, good news, I can carry on creating more complex labs and test some scripting/automation stuff.
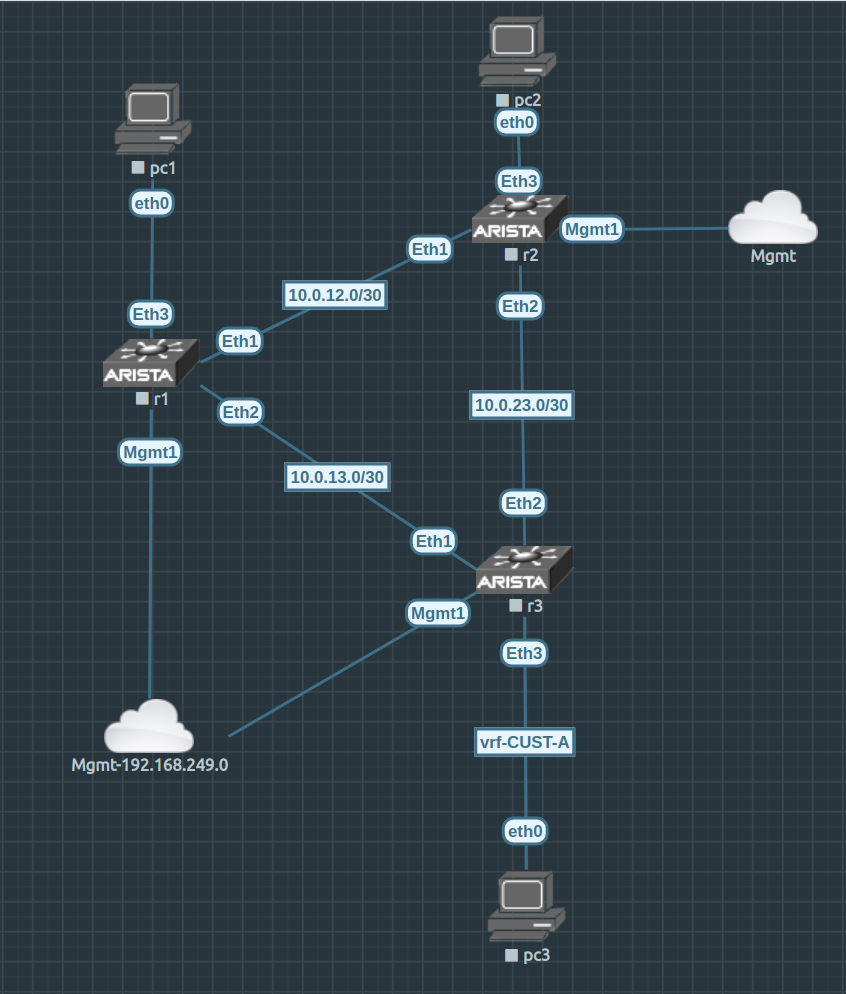
This is the latest diagram: