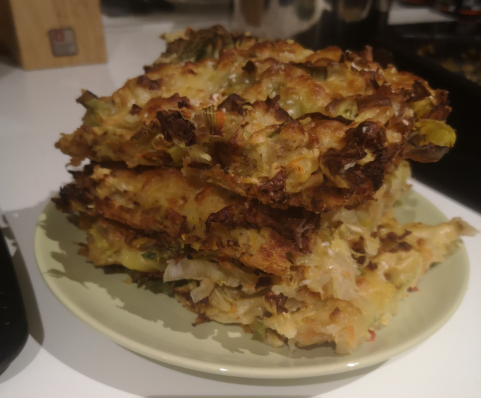
To be honest, I dont know how to translate it, but I found the video randomly and gave it a go. Quite happy with the result.
Ingredients:
4 potatoes
1 leek
2 carrots
100 grams of spinach
1 red pepper
4 medium eggs
4 tablespoons of olive oil,
4 tablespoons of milk
4 tablespoons of flour
1/2 pack of baking powder
2 teaspoons salt, peppe
50 grams of grated cheese
Sesame seeds
Process:
1) Slice the leeks, red pepper and spinach. The add the potatoes and carrots grated. Mix all together.
2) In a bowl, whisk the eggs with the oil. Add the flour and whisk. Add the milk and whisk. Add the baking powder and whisk. Add the salt and pepper and whisk.
3) Pour the butter into the veggie try. Mix everything. Try to flat out the mix as much as you can.
4) Put the try in a pre-heat oven at 180C for 25 minutes.
5) Remove from the oven and add the cheese and sesame seeds. Put back in the oven until cheese forms a crust.
6) Remove from oven and let is cool down for a bit. Then cut in squares.
I fancied something light to read. Oh, how enjoyed those memories when I wished to be an archaeologist like Indy. It was like watching the movie again. I didnt care I knew every twist. It brought me some smiles. Pity I devoured it so fast. Will get to the last one at some point.
I had this book in the pipeline after reading “mindset”. I dont know but some part of me always think that I am going to find my universal solution in a book. The good thing, the other part knows that is not possible. We are happy at the end. My goal is to reach a stable state of “contentment” and resilience enough to weather anything found throw life. Contentment is enjoying (different from pleasure) what I do: working, cooking, reading, sport, etc. In balance. The books explain the search for happiness in our world. How the materialistic approach doesnt work and why and how some people reach it. You need a challenge, effort, instructions, goals, feedback, etc. One quite important thing is the challenge has to be possible with our skills. So we can improve our skills and grow. If it is too much, you may not even try and if you try, you will fell worse. This is very important in the work environment where all of us spent most of our time. How would be your life if you enjoy your work? I have reached a point, that enjoying is the most important point. And yes, money is important, but is not all. It is a balance. But not all is work, so finding meaning outside work is important too. So as the author says, the goal is to have a “flow” life. There is no work-life, family-life. There is just one life. And we need to find the way to enjoy our work (life)
I was quite surprised with the section about “The Waste of Free Time”, just two pages, but hit me hard. How eager we are for having free time but then we dont use it properly. It is mainly for the entertainment industry benefit.
“The future will belong not only to the educated, but to who is educated to use her/his leisure wisely”.
Another section very close to me is “Solitude”. It remind me to a Rafael Santandreu book. In a society/world where everything has to be connected. To be alone, looks like a recipe for disaster. But it doesnt have to be that way. I am in that path. For that I think it is very important to put order in your mind, and avoid “chaos”. Again, it is putting your goals, getting feedback, instructions, etc. It is your meaning.
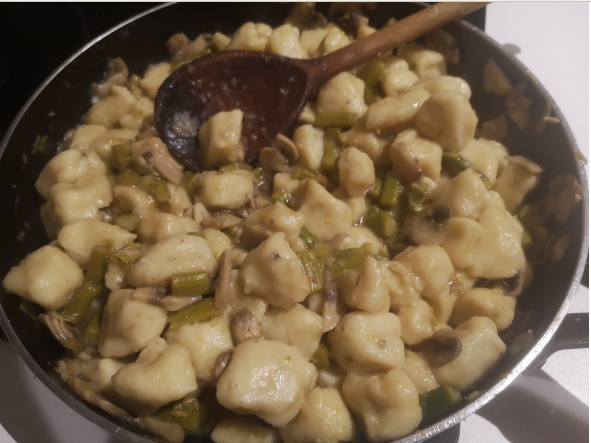
I wanted to make a gnocchi dish for some time. I had a recipe at hand so I went for it. I used this video as a based for the gnocchi
Gnocchi in mushroom and asparagus sauce.
Gnocchi:
1kg of boiled potatoes
2 medium eggs
salt/pepper
20g Parmesan cheese
150g plain flour plus dusting
Mushroom and asparagus sauce:
a couple of garlic cloves
200g mushrooms
150g asparagus
1/2 cup of white wine
1 cup of chicken stock
Parmesan cheese
optional: lemon zest
Gnocchi Process:
1) You can boil or bake the potatoes. Let it cool down a bit until you can manage with your hands. Keep the water for next steps.
2) Put in a bowl, use a potato smasher to break them a bit.
3) Add the eggs, salt, pepper and cheese. Mix a bit .and then
4) Add the flour. You should get a ball. Be sure everything is properly combined.
5) Get a saucepan with boiling water and salt from the first step.
6) In your work surface, dust it with flour, device your dough in several parts. Roll each one until you have a flaute form. Add flour if it sticks too much. Cut them in small pieces
7) Boil the gnocchi until the float. Remove from water and let them cool down in a try (put some olive oil so they dont stick to it)
Sauce Process:
1) Fry the garlic in a sauce pan
2) Add chopped mushrooms and asparagus. Salt and pepper. And other herbs you fancy
3) Once the veggies are fried (medium-high heat), add the wine. It should evaporate quickly and form some brown bits in the pan.
4) reduce heat, add the chicken stock. Stir from time to time until thickens a bit.
5) Add the gnocchi to the sauce, with some pasta water. Be sure they are fully coated.
6) You can fry a bit the gnocchi, be sure there is sauce left!
7) Optional, add a bit of lemon zest.
7) Remove pan from the heat, and let cool down for a bit. Ready to eat!
I was surprised by the gnocchi, they were much better than the ones you buy. It was like small dumplings balls! Very tasty.
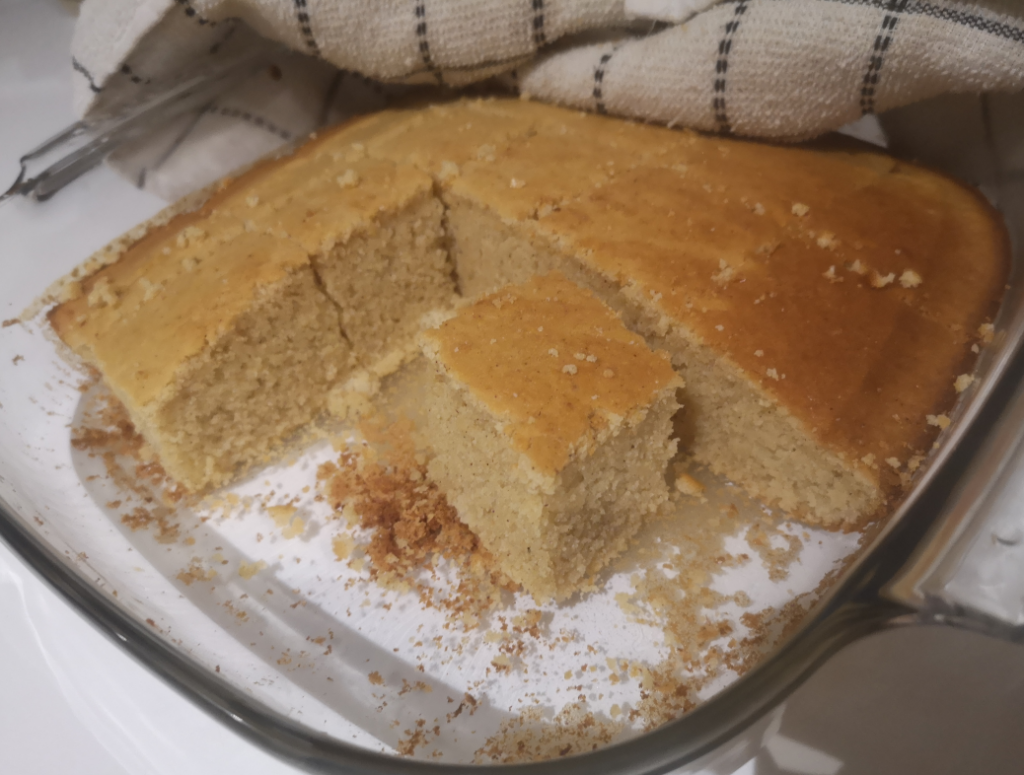
3) Add the eggs, one at each time. Only add the next one when is everything is properly combined
4) Add the flour, milk and salt until fully combined. Pour the mix into the baking try.
5) Bake for 20 minutes or until golden. Use a knife and be sure it comes up clean. Set aside to cool down
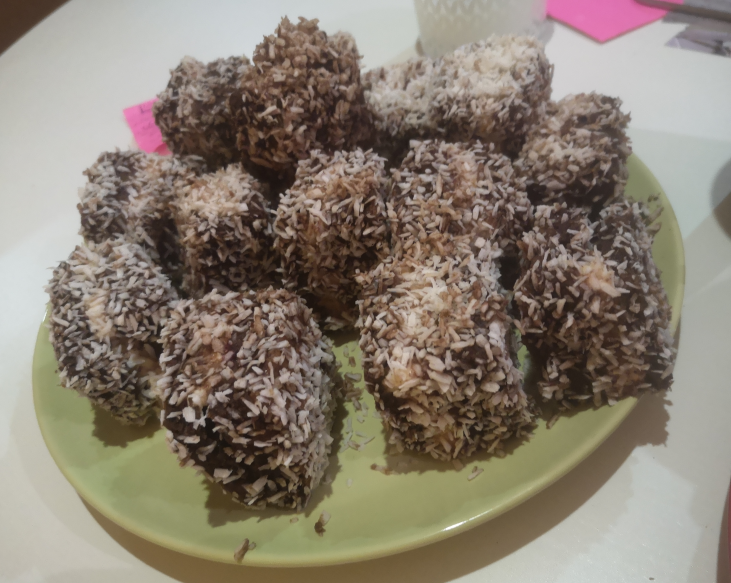
6) Filling: In a bowl, sift the icing sugar and add the double cream. Mix with a hand blender until thick.
7) Once the sponge is cold, slice it horizontally. In one side, pour the filling (use a spoon through boiling water to help you to spread it easier).
8) On top of the filling, pour the jam, use again the spoon through boiling water.
9) Sandwich the sponge back together. Let is chill in the fridge while preparing the coating.
10) Whisk together the melted butter and milk in a bowl. In other bowl, sieve the cocoa powder and icing sugar. Bit by bit, add the cocoa/sugar mix to the butter mix. Whisk until no lumps.
11) Cut the sponge in squares, dip each square in the cocoa mix until properly coated. Then roll in the desiccated coconut. Put aside.
12) Once all squares are done, sprinkle some more coconut.
13) Let the cocoa coating to settle for 1h. But next day are even better!
Again, I am following the author post but adapting it to my environment using libvirt instead of VirtualBox and Debian10 as VM. All my data is here.
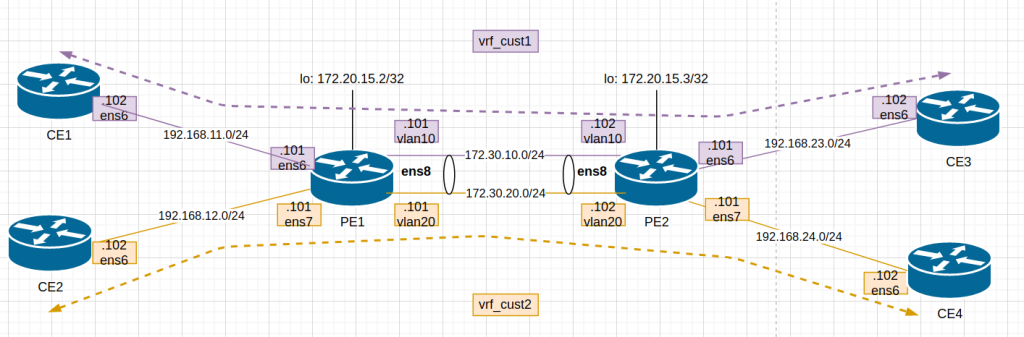
This is the diagram adapted to my lab:
After updating Vagrantfile and provisioning script, I “vagrant up”. The 6 VMs dont take long to boot up so it is a good thing.
The provisioning script is mainly for configuration of PE1 and PE2 . This is a bit more detail:
    # enabling ipv4 forwarding (routing)
    sudo sysctl net.ipv4.ip_forward=1

    # add loopback (not used in lab3)
    sudo ip addr add 172.20.5.$self/32 dev lo

    # removing ip in link between pe1-pe2 as we will setup a trunk with two vlans.
    sudo ip addr del 192.168.66.10$self/24 dev ens8

    # creating two vlans 10 (ce1,ce3) and 20 (ce2, ce4)
    sudo ip link add link ens8 name vlan10 type vlan id 10
    sudo ip link add link ens8 name vlan20 type vlan id 20

    # assign IP to each vlan
    sudo ip addr add 172.30.10.10$self/24 dev vlan10
    sudo ip addr add 172.30.20.10$self/24 dev vlan20

    # turn up each vlan as by default are down
    sudo ip link set vlan10 up
    sudo ip link set vlan20 up

    # create two routing tables with a null route
    sudo ip route add blackhole 0.0.0.0/0 table 10
    sudo ip route add blackhole 0.0.0.0/0 table 20

    # create two VRFs and assign one table (created above) to each one
    sudo ip link add name vrf_cust1 type vrf table 10
    sudo ip link add name vrf_cust2 type vrf table 20

    # assign interfaces to the VRFs            // ie. PE1:
    sudo ip link set ens6 master vrf_cust1     // interface to CE1
    sudo ip link set vlan10 master vrf_cust1   // interface to PE2-vlan10

    sudo ip link set ens7 master vrf_cust2     // interface to CE2
    sudo ip link set vlan20 master vrf_cust2   // interface to PE2-vlan20

    # turn up VRFs
    sudo ip link set vrf_cust1 up
    sudo ip link set vrf_cust2 up

    # add static route in each VRF routing table to reach the opposite CE
    sudo ip route add 192.168.$route1.0/24 via 172.30.10.10$neighbor table 10
    sudo ip route add 192.168.$route2.0/24 via 172.30.20.10$neighbor table 20
Check the status of the VRFs in PE1:
vagrant@PE1:/vagrant$ ip link show type vrf
 8: vrf_cust1:  mtu 65536 qdisc noqueue state UP mode DEFAULT group default qlen 1000
     link/ether c6:b8:f2:3b:53:ed brd ff:ff:ff:ff:ff:ff
 9: vrf_cust2:  mtu 65536 qdisc noqueue state UP mode DEFAULT group default qlen 1000
     link/ether 62:1c:1d:0a:68:3d brd ff:ff:ff:ff:ff:ff
 vagrant@PE1:/vagrant$
 vagrant@PE1:/vagrant$ ip link show vrf vrf_cust1
 3: ens6:  mtu 1500 qdisc pfifo_fast master vrf_cust1 state UP mode DEFAULT group default qlen 1000
     link/ether 52:54:00:6f:16:1e brd ff:ff:ff:ff:ff:ff
 6: vlan10@ens8:  mtu 1500 qdisc noqueue master vrf_cust1 state UP mode DEFAULT group default qlen 1000
     link/ether 52:54:00:33:ab:0b brd ff:ff:ff:ff:ff:ff
 vagrant@PE1:/vagrant$
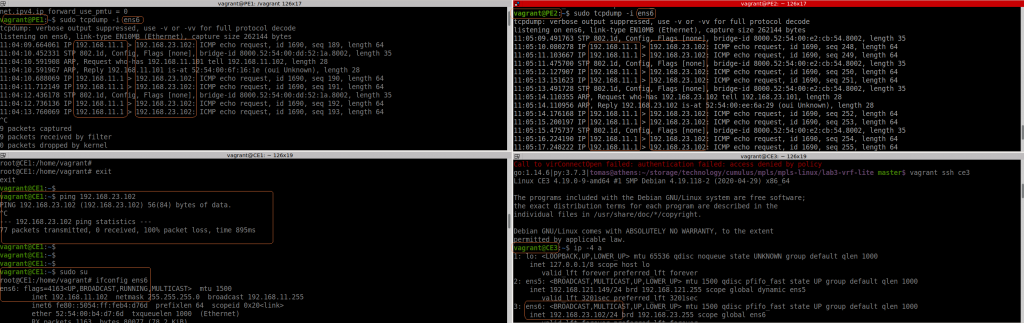
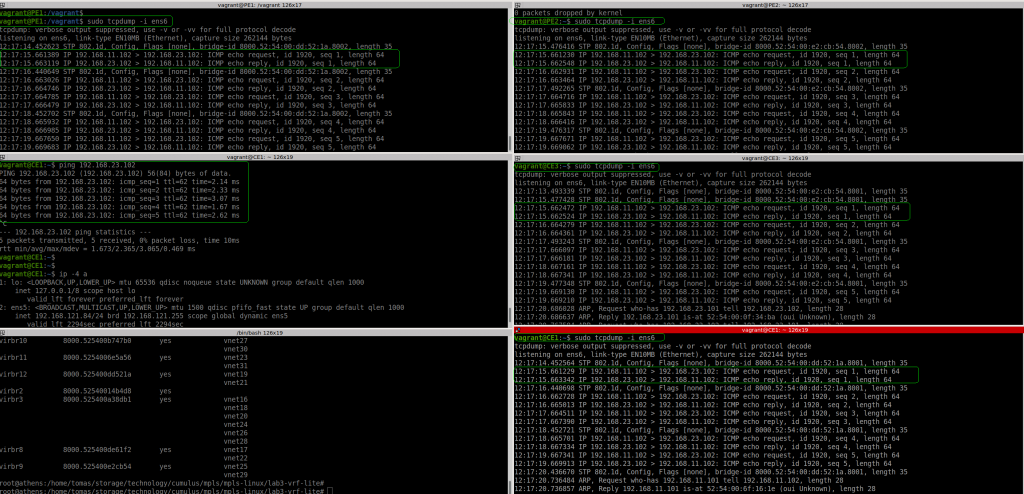
So let’s test if we can ping from CE1 to CE3:
Ok, if fails. I noticed that PE1 sees the packet from CE1… but the source IP is not the expected one (11.1 is the host/my laptop). And the packet reaches to PE2 with the same wrong source IP and then to CE3. In CE3 the ICMP reply is sent to 11.1, to it never reaches CE1.
The positive thing is that VRF lite seems to work.
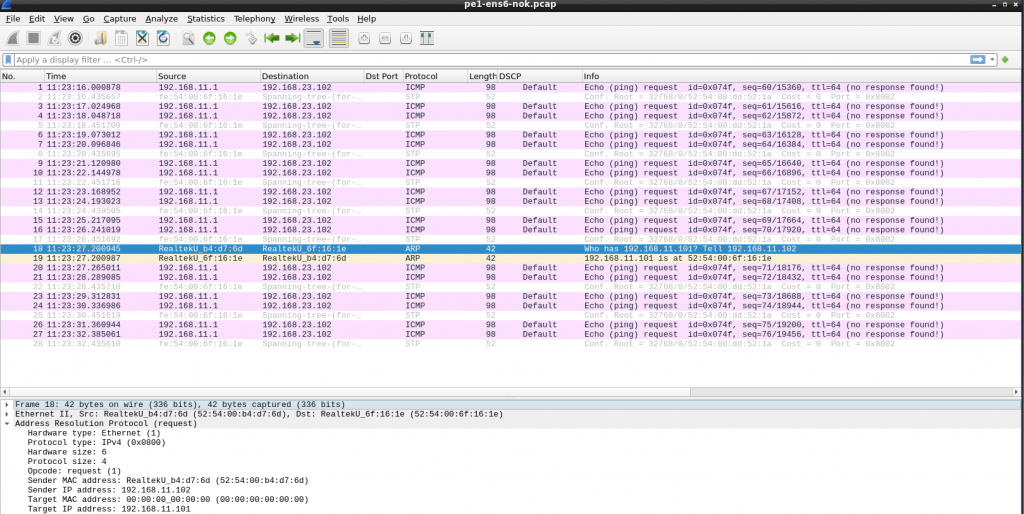
I double checked all IPs, routing, etc. duplicated MAC in CE1 and my laptop maybe??? I installed “net-tools” to get “arp” command and check the arp table contents in CE1. Checking the ARP request in wireshark, all was good.
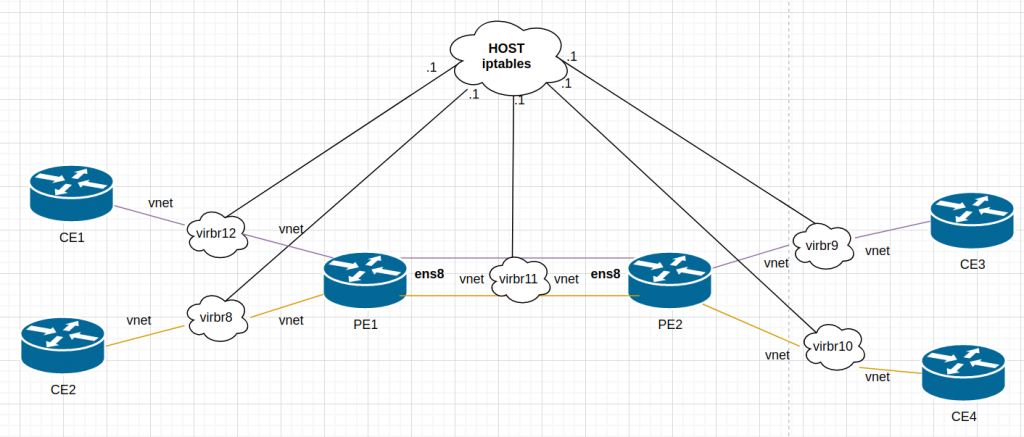
Somehow, the host was getting involved…. Keeping in mind that this is a simulated network, the host has access to all “links” in the lab. Libvirt creates a bridge (switch) for each link and it adds a vnet (port) for each VM that uses it:
“.1” is always the host but It was clear my routing was correct in all devices. I remembered that I had some issues during the summer when I was playing with containers/docker and doing some routing…. so I checked iptables….
I didnt have iptables in the VMs… but as stated earlier, the host is connected to all “links” used between the VMs. There is no real point-to-point link.
# iptables -t nat -vnL --line-numbers
...
Chain LIBVIRT_PRT (1 references)
num   pkts bytes target     prot opt in     out     source               destination
1       11   580 RETURN     all  --  *      *       192.168.11.0/24      224.0.0.0/24
2        0     0 RETURN     all  --  *      *       192.168.11.0/24      255.255.255.255
3        0     0 MASQUERADE  tcp  --  *      *       192.168.11.0/24     !192.168.11.0/24      masq ports: 1024-65535
4       40  7876 MASQUERADE  udp  --  *      *       192.168.11.0/24     !192.168.11.0/24      masq ports: 1024-65535
5       16  1344 MASQUERADE  all  --  *      *       192.168.11.0/24     !192.168.11.0/24
6       15   796 RETURN     all  --  *      *       192.168.24.0/24      224.0.0.0/24
7        0     0 RETURN     all  --  *      *       192.168.24.0/24      255.255.255.255
8        0     0 MASQUERADE  tcp  --  *      *       192.168.24.0/24     !192.168.24.0/24      masq ports: 1024-65535
9       49  9552 MASQUERADE  udp  --  *      *       192.168.24.0/24     !192.168.24.0/24      masq ports: 1024-65535
10       0     0 MASQUERADE  all  --  *      *       192.168.24.0/24     !192.168.24.0/24


# iptables-save -t nat
# Generated by iptables-save v1.8.7 on Sun Feb  7 12:06:09 2021
*nat
:PREROUTING ACCEPT [365:28580]
:INPUT ACCEPT [143:14556]
:OUTPUT ACCEPT [1617:160046]
:POSTROUTING ACCEPT [1390:101803]
:DOCKER - [0:0]
:LIBVIRT_PRT - [0:0]
-A PREROUTING -m addrtype --dst-type LOCAL -j DOCKER
-A OUTPUT ! -d 127.0.0.0/8 -m addrtype --dst-type LOCAL -j DOCKER
-A POSTROUTING -s 172.17.0.0/16 ! -o docker0 -j MASQUERADE
-A POSTROUTING -s 172.18.0.0/16 ! -o br-4bd17cfa19a8 -j MASQUERADE
-A POSTROUTING -s 172.19.0.0/16 ! -o br-43481af25965 -j MASQUERADE
-A POSTROUTING -j LIBVIRT_PRT
-A POSTROUTING -s 192.168.122.0/24 -d 224.0.0.0/24 -j RETURN
-A POSTROUTING -s 192.168.122.0/24 -d 255.255.255.255/32 -j RETURN
-A POSTROUTING -s 192.168.122.0/24 ! -d 192.168.122.0/24 -p tcp -j MASQUERADE --to-ports 1024-65535
-A POSTROUTING -s 192.168.122.0/24 ! -d 192.168.122.0/24 -p udp -j MASQUERADE --to-ports 1024-65535
-A POSTROUTING -s 192.168.122.0/24 ! -d 192.168.122.0/24 -j MASQUERADE
-A DOCKER -i docker0 -j RETURN
-A DOCKER -i br-4bd17cfa19a8 -j RETURN
-A DOCKER -i br-43481af25965 -j RETURN
-A LIBVIRT_PRT -s 192.168.11.0/24 -d 224.0.0.0/24 -j RETURN
-A LIBVIRT_PRT -s 192.168.11.0/24 -d 255.255.255.255/32 -j RETURN
-A LIBVIRT_PRT -s 192.168.11.0/24 ! -d 192.168.11.0/24 -p tcp -j MASQUERADE --to-ports 1024-65535
-A LIBVIRT_PRT -s 192.168.11.0/24 ! -d 192.168.11.0/24 -p udp -j MASQUERADE --to-ports 1024-65535
-A LIBVIRT_PRT -s 192.168.11.0/24 ! -d 192.168.11.0/24 -j MASQUERADE
-A LIBVIRT_PRT -s 192.168.24.0/24 -d 224.0.0.0/24 -j RETURN
-A LIBVIRT_PRT -s 192.168.24.0/24 -d 255.255.255.255/32 -j RETURN
-A LIBVIRT_PRT -s 192.168.24.0/24 ! -d 192.168.24.0/24 -p tcp -j MASQUERADE --to-ports 1024-65535
-A LIBVIRT_PRT -s 192.168.24.0/24 ! -d 192.168.24.0/24 -p udp -j MASQUERADE --to-ports 1024-65535
-A LIBVIRT_PRT -s 192.168.24.0/24 ! -d 192.168.24.0/24 -j MASQUERADE
Ok, it seems the traffic form 192.168.11.0 to 192.168.23.0 is NAT-ed (masquerade in iptables). So makes sense that I see the traffic as 11.1 in PE1. Let’s remove that:
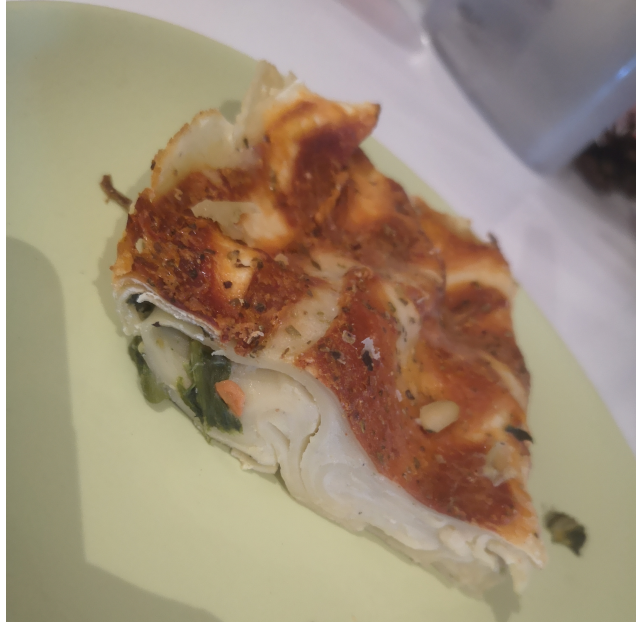
Pasta bolognesa was my favourite dish as a kid. We had it I think once every week. Canelones was another big one but my mum didnt cook it that often as it was more time consuming assembling the canelones and preparing the white sauce.
Anyway, I wanted to try the spinach version so I found this recipe that looked nice. I used lasagna sheets cut in two for the canelones and worked nicely.
Ingredients for filling
12 lasagna sheets
250g frozen spinach (put in boiling water to unfreeze)
1 chopped onion
1 piece of garlic
1 boiled egg
20g of pine nuts
a bit of grated parmesan cheese (or similar hard cheese)
Ingredients for bechamel sauce:
2-3 big tsp of plain flour
25g of butter
nutmeg
salt and pepper
200ml milk
grated parmesan cheese
Process
Boil 1l water in a pan, with salt and a bit of olive oil. Once boiling, put lasagna sheet in 2-3 at each time. They should be ready in a couple of minutes (they should float). Remove and leave it rest.
In a sauce pan, heat some oil, add the onion and garlic. Until soft
Add the unfrozen spinach, keep stirring.
Add the pine nuts and the boiled egg (cut in small pieces). Salt and pepper.
Add a bit of cheese.
Retire from the heat.
In a saucepan, melt the butter, add the flour little by little until forming a paste.
Start adding the milk, again little by little stirring without stopping. This is at low-medium heat. Add nutmet, salt and pepper. Taste from time to time. Add the cheese at the end.
Once you have a sauce that is not very liquid neither thick, we are ready to assemble everything.
Pre-heat oven at 200C
Put some of the bechamel in the spinach mix and stir.
Prepare an oven dish. Put some butter or bechamel sauce in the dish to avoid stickiness.
Take the cold lasagne sheets, cut in two squares. In each square put a spoon of the spinach mix and roll like a canelone. Put in the oven dish in lines.
Once you the oven dish covered with canelones, pour the bechamel soauce on top of them. Add some grated cheese. I had some tomato sauce left over and I add it too.
Put the oven dish in the oven. 30m or until the top is grilled.
I read this book in 2019 about fermentation as I was already doing sourdough and wanted to learn more things. It is a great about anything related to fermentation. From there I started doing sauerkraut (still haven’t achieved the required results though). Another thing I wanted to try was kombucha, a fermented fizzy drink. I thought it was difficult to develop the scoby until I watched this video and learned that I can buy it! So I got my scobby and started the process:
2- Add two bags of black tea for 10 minutes, then remove the bags.
3- Let it cool down to room temperature
4- Add the mixture to a 1 litre jar, add the scoby with its liquid.
5- Cover the jar with a cloth and leave it somewhere warm for 5 days without direct sunlight (I put it under the sink)
6- Remove the scoby and 100ml of the mix into a small jar, keep it in the fridge for the next batch.
7- Put the rest of the mix into a airtight glass 1l bottle at room temperature for 3-7 days until fizzy. I put it under the sink again. You may release a bit of gas after a couple of days if you dont want to see the bottle explode when opening…
8- Put the bottle in the fridge, and afterwards you can enjoy a refreshing fizzy homemade drink!!!
It is a slow process but it is easy. In my first bottle, I was surprised because it was actually quite fizzy!!! The taste was a kind of cider, redbull , etc without the after taste of dead by sugar.
I am doing my second bottle and at some point I would like to add flavours, like ginger… I need to check if this is consider ginger beer. Although no idea if it generates any alcohol… (there is a fermentation process involved and breakdown of sugars….)
Happy with it, and hopefully adding to my routine.
I finished “Greenlights” and really enjoyed. I am not very keen of famous people as I think they are overrated but I had watched some motivational videos from Matthew McConaughey in youtube and decided to give it a go.
BTW, this is the best definition (minute 2) for trading you can find anywhere. After this you will not need to apply for a MBA.
It has been a very engaging read, the typical book that you wish it had more pages. It is about “livin” as they author writes. You see the experiences, problems, adventures of a human being. With all the lessons. It is like spending a whole night with a person you just met or a good friend, enjoying dinner, and a drink (or two) and a smoke (or two) and you open up totally, mutually: good, bad, worse, best things. Until sunrise. Intense but soothing .
When you dont have much social interactions, sometimes, you only source of “experience” apart from yours, it is a book. And I feel I learned from it.