This cake doesnt have a specific name. I found it in a magazine from my supermarket. I have a pile of recipes collected over the years and rarely try them. But I fancied cooking something related to ginger and this cake looked ideal.
Ingredients:
- 125g butter, softened
- 50g of peeled ginger. Then grate it
- 150g pitted dates (if they are hard, put them in boiling water for 30 minutes until soft)
- 100g plain wholemeal flour
- 75g oats
- 4 eggs
- 2 tsp baking powder
- 3 tsp honey or agave sirup
- 150g soft cheese
- 1 lime zested
Process:
- Preheat oven at 180C. Prepare a loaf tin with non-stick paper or spread some butter.
- In food processor. Cream the butter, then add the grated ginger, dates, flour and oats. Once all combined (pieces of date are ok), add eggs, baking powder and honey.
- Pour the mix into the tin. Bake it for 1h. Cover with foil for the last 10-15 minutes if it browns to much. Remove from the oven once you insert a knife and comes out clean
- While it rests, whisk the soft cheese, 1 tsp honey and the lime zest. Give a taste, it should have a hint of lime, no too strong.
- The spread the mix on top of the cake. Ready to eat!
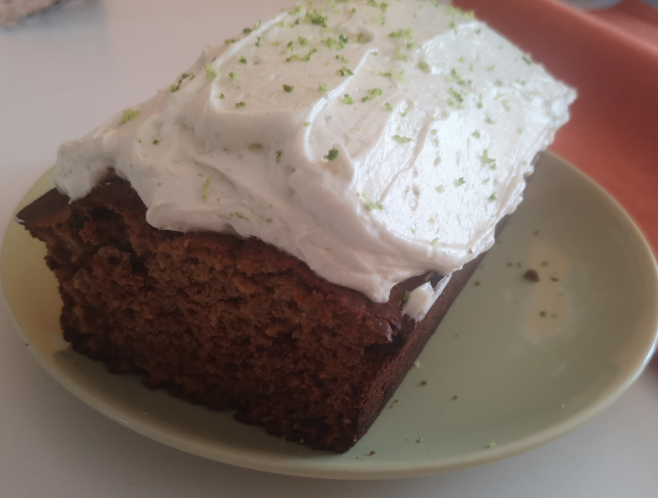
It doesnt taste too sweet (most sugar comes from the dates). And the ginger taste is not very strong neither. Having the soft cheese with lime I think it balances. Maybe I should have added more lime but for the first time, it was good!