Something very basic but took me several hours to workout. I had a VM that I wanted to increase a VG as I wanted to create a new LV. I increased the partition in the host server so the PV of the VG had the extra space, but then I couldnt see the increase inside the VM:
"fdisk" was telling me the disk was already 300G...
[root@VM ~]# fdisk /dev/vdb

Welcome to fdisk (util-linux 2.32.1).
Changes will remain in memory only, until you decide to write them.
Be careful before using the write command.

The old LVM2_member signature will be removed by a write command.

Device does not contain a recognized partition table.
Created a new DOS disklabel with disk identifier 0xd46fa2fc.

Command (m for help): p
Disk /dev/vdb: 300 GiB, 322122547200 bytes, 629145600 sectors
Units: sectors of 1 * 512 = 512 bytes
Sector size (logical/physical): 512 bytes / 512 bytes
I/O size (minimum/optimal): 512 bytes / 512 bytes
Disklabel type: dos
Disk identifier: 0xd46fa2fc
I did a pvscan... and nothing. What I was missing? just "pvresize".... and then I can see my extra 100G in the PV and in the VG. So I can create the new LV I wanted...
I was reading an article about tools to write python using VIM with good formatting. I am not a pro-user of VIM neither a pro-python programmer but I would like to be more efficient and write better formatted python code.
So this is the link I was reading and ended here for the specific details.
At the end, my goal is to use more often inside VIM: splits (:sp), nerdtree (file browsing), autocompletion, git and be sure my code is formatted automatically if I make a mistake.
So I enabled most of the plugins from the article although I made some tweaks for me normal usage (I already had enabled some pluggins for jinja2). This is my .vimrc:
set nocompatible              " be iMproved, required
filetype off                  " required

" set the runtime path to include Vundle and initialize
set rtp+=~/.vim/bundle/Vundle.vim

" https://realpython.com/vim-and-python-a-match-made-in-heaven/#syntax-checkinghighlighting
set splitbelow
set splitright
"split navigations
nnoremap
nnoremap
nnoremap
nnoremap

" Enable folding
set foldmethod=indent
set foldlevel=99
" Enable folding with the spacebar
nnoremap  za

" Automatic formating for tab, whitespace and max 80 chars per line, etc
au BufNewFile,BufRead *.py
    \ set tabstop=4 |
    \ set softtabstop=4 |
    \ set shiftwidth=4 |
    \ set textwidth=79 |
    \ set expandtab |
    \ set autoindent |
    \ set fileformat=unix

highlight BadWhitespace ctermbg=red guibg=darkred
au BufRead,BufNewFile *.py,*.pyw,*.c,*.h match BadWhitespace /\s\+$/

set encoding=utf-8

let python_highlight_all=1

" VUNDLE PLUGINGS

call vundle#begin()
" alternatively, pass a path where Vundle should install plugins
" call vundle#begin('~/some/path/here')

" let Vundle manage Vundle, required
Plugin 'VundleVim/Vundle.vim'
" added nerdtree
Plugin 'scrooloose/nerdtree'

Plugin 'ctrlp.vim'

Plugin 'Jinja'

Plugin 'tmhedberg/SimpylFold'

Plugin 'vim-scripts/indentpython.vim'

Plugin 'vim-syntastic/syntastic'

Plugin 'nvie/vim-flake8'

Plugin 'tpope/vim-fugitive'

Plugin 'Lokaltog/powerline', {'rtp': 'powerline/bindings/vim/'}

" Keep Plugin commands between vundle#begin/end.
" All of your Plugins must be added before the following line
call vundle#end()            " required


filetype plugin indent on    " required
syntax on

nmap  :NERDTreeToggle

" To ignore plugin indent changes, instead use:
"filetype plugin on
"
" Brief help
" :PluginList       - lists configured plugins
" :PluginInstall    - installs plugins; append `!` to update or just :PluginUpdate
" :PluginSearch foo - searches for foo; append `!` to refresh local cache
" :PluginClean      - confirms removal of unused plugins; append `!` to auto-approve removal
"
" see :h vundle for more details or wiki for FAQ
" Put your non-Plugin stuff after this line


au BufNewFile,BufRead *.lmx set filetype=xml
au BufNewFile,BufRead *.dump set filetype=sql
au BufNewFile,BufRead *.j2 set filetype=jinja

"for case-insensitve searches"
set ignorecase

"Override the 'ignorecase' option if the search pattern contains upper"
"case characters.  Only used when the search pattern is typed and"
"'ignorecase' option is on."
set smartcase

" I want to be able to resize the splits quickly so I want the mouse on
set mouse=a

" Always show statusline - This makes powerline always on
set laststatus=2

" autocmd vimenter * NERDTree
BTW, a quick reference for NerdTree (file browser) here.
I like git, I use it, but of course, I am not an expert. And everytime I want to do something outside my comfort zone, I have to serch for help. Will try to add expamples. Most of them will be obvius for most people.
I want to see the differences between the files I have changed (before commit) and the last commit. Thanks to stackoverflow:
S3 is the Amazon service to store files in the cloud. It is reliable, very reliable, the expected time to lost a single file from a group of 10 million of them is 10000 years. Even other services on Amazon uses internally S3 to store its files. On the bad side, as it is one of the first services that Amazon created, it can be a headache to fine grain permissions form all its capabilites and evolutions, making it difficult to be sure that a file is not accesible for those that should not be allowed.
In S3 you can define what they call a bucket, which is like a directory in a filesystem. The name of the bucket must be unique, not only in your account but in the global namespace from all AWS accounts in the world. That means you have to be creative when picking a bucket name.
A bucket can be private or publicly accessible. In the public side, one of the special uses is to serve static content from as a web server, even html pages from your custom domain. But what if you want to allow users to download files, for example an image, and you don’t want the user to be able to make it public sharing the link to the image?
I’ve played today with a very useful feature for that case. It allows to have a private bucket that can temporary allow the access to a single file to GET or even PUT/POST for a limited amount of time. You’ll need to use AWS SDK of your favourite supported programming language or AWS CLI from command line, to query AWS API for a temporary authorized url. Let’s see how with an example from scratch, installing and using AWS CLI in a Debian based environment.
Make sure you have access to an AWS account (you already have one if you have an amazon.com account) and generate a pair of AWS Access Key and AWS Secret Access Key from web console.
$> sudo apt instal awscli
$> aws configure
AWS Access Key ID [None]:
AWS Secret Access Key [None]:
Default region name [None]: eu-west-1
Default output format [None]:
Create a local file called piticli with the content you prefer. Let’s create also a new S3 bucket using aws cli
# Create a convenience environment variable with a kind of random bucket name
$> BN="s3://thomarite-blog-test-$RANDOM"
# Let's actually create the bucket
$> aws s3 mb $BN
make_bucket: thomarite-blog-test-1337
# Let's see it exists
$> aws s3 ls
2020-04-16 23:01:27 thomarite-blog-test-1337
# Now let's upload piticli into the new bucket
$> aws s3 cp piticli $BN
2020-04-17 23:01:45          26 piticli
Now let’s create a presigned url for piticli and store it in PRESIGNED_URL env var. As you can see, the temporary URL includes the bucket name, the file name and new AWS Access Key and signature, and a hint about the expiration date.
# Store the URL into a env var for future use
$> PRESIGNED_URL=$(aws s3 presign $BN/piticli)
$> echo $PRESIGNED_URL
https://s3.eu-west-1.amazonaws.com/thomarite-blog-test-1337/piticli?AWSAccessKeyId=AKIAYSFFLHZCQSEPMZEF&Signature=x%2BWzELvYpzdVipOd67ez0z3Esws%3D&Expires=1587077637
That’s the public url and will be valid for 1h by default. You can set the expiration time in aws s3 presign command using the parameter --expires-in and set the seconds allowed until it expires.
Now you have a public url accessible by any browser. Let’s open it via curl:
$> curl -Ls $PRESIGNED_URL
piticli is now… sleeping
And finally to clean things up let’s remove all the files and the bucket in AWS
Today I had to troubleshoot a websocket issue. I had never dealt with this before. I was told that HAproxy config was fine that it was to be our NGFW doing something nasty at L7.
The connection directly to the server doing websocket was fine from my PC but for some requirement we need to put that server behing a HAproxy. From my PC to the haproxy that is doing “proxy” fore the websocket service failed…
Funny enough HAproxy and the websocket service were running in the same host.
As usual I took a look at the firewall logs. Nothing wrong there at first sight. I took a tcpdump from my pc when connecting to the websocket service and to the haproxy.
The service is very verbose and it is difficult to follow in the capture files as it spawns several connections. I went to the easy part, the capture to the haproxy was showing a lot of TCP retransmissions… The other trace to the websocket service was pretty clean.
Taking into account that the path from my PC to the haproxy server is the always the same (and I was going through a VPN) I could think it was a NGFW issue or something between HAproxy and the websocket service (that is a localhost connection).
As well, I was seeing weird things latency wise. Some TCP resets were taking more than 200ms to arrive to the server when the average RTT was 3ms.
I tried to take a tcpdump between the haproxy service and the websocket service just in case that packet loss was caused locally. The capture was chaos to follow. I had to understand better the sessions in HAproxy.
I changed direction and I went to the NGFW and created a rule that disabled any fancy security check for me to the haproxy server. I wanted to be sure the firewall was innocent.
It was. Same issue. I tried different browsers and always the same.
So I was nearly sure the problem was in HAproxy but I had to prove it. I kind of failed checking the backend connection (haproxy to websockt proxy) so I took again a look to the trace from my pc to haproxy. I was quite frustrated because there was so many connetions openned and then retransmissions started happening that I couldnt really see any problem.
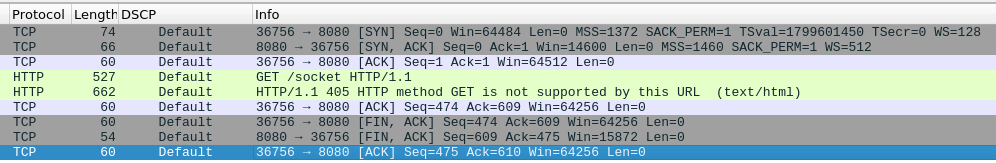
By luck, I noticed that in the good trace (the one going directly to the websocket service) I could see a HTTP GET request for “socket” from my PC. Keep in mind that I have no idea how websocket works. I tried to find a similar request in the haproxy trace, and I saw the problem….
Rejected HTTP GET socket request
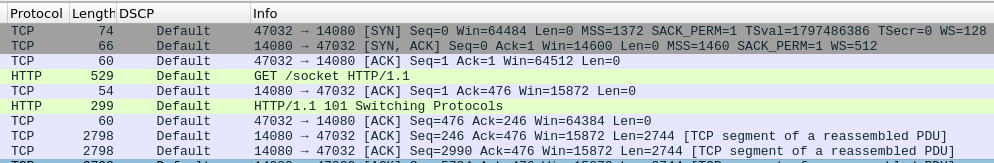
and this is a good connection:
Successful HTTP GET socket request
So at the end, HAproxy was at fault (we dont know how to fix it though yet) and my firewall (for once) it is innocent.
The summary, I got overwhelmed by the TCP retransmissions. I was lucky that I saw the GET socket and I assumed that had to be the way to get the websocket connection established. So I should have started investigating how a websocket connections is stablished. As well, I didnt manage to find the HAproxy logs, I am pretty sure I should have found the same answer. So I need to learn to check that.
I learned something new. As usual, it didnt come easy neither quick 🙂
But at the end, it is not all about the Bloom filters. It is understanding how things work under the hood and see if they are actually delivering, if not, you should change your approach. So the debugging section “A secret weapon – a profiler” is very good. Profiling is not one of my strengths so the tools used are the ones I need to understand and use more often:
strace -cf
perf stat -d
perf record
perf record | head -n 20
perf annotate process_line --source
google-perftools' with kcachegrind
As well the reference to the performance numbers that are good to have in mind:
Notice the magnitude differences in the performance of different options.
Datacenters are far away so it takes a long time to send anything between them.
Memory is fast and disks are slow.
By using a cheap compression algorithm a lot (by a factor of 2) of network bandwidth can be saved.
Writes are 40 times more expensive than reads.
Global shared data is expensive. This is a fundamental limitation of distributed systems. The lock contention in shared heavily written objects kills performance as transactions become serialized and slow.
Architect for scaling writes.
Optimize for low write contention.
Optimize wide. Make writes as parallel as you can.
As well, “The lessons learned” is a great summary of his trip.
Sequential memory access great / Random memory access costly -> cache prefetching
Advanced data structures to fit L3: optimize for reduced number loads than the amount of memory used.
I use gkrellm as my linux monitoring app. I have used it since I started but something I miss is I would like to know what app and destination IPs are causing a traffic spike in my laptop.
Searching a bit a come up with this page with several tools:
A couple of weeks ago, at work, sysadmin guys were working on some ZFS issues. They were talking about ZIL and ARC, and I had no idea what was that.
I always wanted to run ZFS, so I think early 2019 I configured my laptop to use ZFS, not in the root partition but in a different partition. I had to configure my Debian Testing to support ZFS (I dont remember if it was very difficult) and then backup some data to make room for my new ZFS partition.
For ZFS basics, you can follow the link below but there are many good tutorial searching in your favourite engine:
# zpool status
  pool: storage
 state: ONLINE
status: Some supported features are not enabled on the pool. The pool can
	still be used, but some features are unavailable.
action: Enable all features using 'zpool upgrade'. Once this is done,
	the pool may no longer be accessible by software that does not support
	the features. See zpool-features(5) for details.
  scan: scrub repaired 0B in 0 days 00:10:39 with 0 errors on Sun Jan 12 00:34:40 2020
config:

	NAME                  STATE     READ WRITE CKSUM
	storage               ONLINE       0     0     0
	  laptop--vg-storage  ONLINE       0     0     0

errors: No known data errors
#
This is too basic, in most cases your will want to have a kinf of RAID. But again, this is a simple laptop. As well, you can configure snapshots (useful if you want to have rollback a server upgrade that involves a huge amount of data) and other performance parameters (as per document below):
Make it permanent, edit /etc/sysctl.conf like this
# Based on https://www.simula.no/file/lj-219-jul-2012pdf/download
# enabling tcp thin-steam modifications for reducing latency in interactive apps
net.ipv4.tcp_thin_linear_timeouts = 1
Now it is time to test and see if you see any improvement or degradation!