Once you have installed the vagrant box (it takes a while) you can “vagrant halt” and start again:
~/storage/technology/linux/bpftracing master$ vagrant status
Current machine states:
default poweroff (virtualbox)
The VM is powered off. To restart the VM, simply run vagrant up
~/storage/technology/linux/bpftracing master$ vagrant up
Bringing machine 'default' up with 'virtualbox' provider…
==> default: Checking if box 'ubuntu/bionic64' version '20200525.0.0' is up to date…
==> default: Clearing any previously set forwarded ports…
==> default: Clearing any previously set network interfaces…
==> default: Preparing network interfaces based on configuration…
default: Adapter 1: nat
==> default: Forwarding ports…
default: 22 (guest) => 2222 (host) (adapter 1)
==> default: Running 'pre-boot' VM customizations…
==> default: Booting VM…
==> default: Waiting for machine to boot. This may take a few minutes…
default: SSH address: 127.0.0.1:2222
default: SSH username: vagrant
default: SSH auth method: private key
==> default: Machine booted and ready!
==> default: Checking for guest additions in VM…
default: The guest additions on this VM do not match the installed version of
default: VirtualBox! In most cases this is fine, but in rare cases it can
default: prevent things such as shared folders from working properly. If you see
default: shared folder errors, please make sure the guest additions within the
default: virtual machine match the version of VirtualBox you have installed on
default: your host and reload your VM.
default:
default: Guest Additions Version: 5.2.34
default: VirtualBox Version: 6.1
==> default: Mounting shared folders…
default: /vagrant => /home/xxx/storage/technology/linux/bpftracing
==> default: Machine already provisioned. Run vagrant provision or use the --provision
==> default: flag to force provisioning. Provisioners marked to run always will still run.
~/storage/technology/linux/bpftracing master$ vagrant ssh
Welcome to Ubuntu 18.04.4 LTS (GNU/Linux 4.15.0-106-generic x86_64)
Documentation: https://help.ubuntu.com
Management: https://landscape.canonical.com
Support: https://ubuntu.com/advantage
System information as of Sun Jun 21 19:25:26 UTC 2020
System load: 0.35 Processes: 99
Usage of /: 32.2% of 9.63GB Users logged in: 0
Memory usage: 12% IP address for enp0s3: 10.0.2.15
Swap usage: 0%
0 packages can be updated.
0 updates are security updates.
Last login: Sun Jun 21 19:22:37 2020 from 10.0.2.2
vagrant@ubuntu-bionic:~$
vagrant@ubuntu-bionic:~$ cd /vagrant/
vagrant@ubuntu-bionic:/vagrant$ ls
Makefile Vagrantfile bpf_program.o monitor-exec
README.md bpf_program.c loader.c ubuntu-bionic-18.04-cloudimg-console.log
vagrant@ubuntu-bionic:/vagrant$
You can find tools (under /usr/sbin)(already compiled and ready to use) or examples (under /usr/share/doc/bpfcc-tools/examples)
These are the tools you can find in the system:
vagrant@ubuntu-bionic:~$ ls -ltr /usr/sbin | grep -i bpfcc
-rwxr-xr-x 1 root root 3496 Nov 29 2017 reset-trace-bpfcc
-rwxr-xr-x 1 root root 7105 Nov 29 2017 deadlock_detector.c-bpfcc
-rwxr-xr-x 1 root root 9029 Mar 27 2018 zfsslower-bpfcc
-rwxr-xr-x 1 root root 5131 Mar 27 2018 zfsdist-bpfcc
-rwxr-xr-x 1 root root 8184 Mar 27 2018 xfsslower-bpfcc
-rwxr-xr-x 1 root root 4431 Mar 27 2018 xfsdist-bpfcc
-rwxr-xr-x 1 root root 6825 Mar 27 2018 wakeuptime-bpfcc
-rwxr-xr-x 1 root root 2636 Mar 27 2018 vfsstat-bpfcc
-rwxr-xr-x 1 root root 1177 Mar 27 2018 vfscount-bpfcc
-rwxr-xr-x 1 root root 2978 Mar 27 2018 ttysnoop-bpfcc
-rwxr-xr-x 1 root root 31977 Mar 27 2018 trace-bpfcc
-rwxr-xr-x 1 root root 4159 Mar 27 2018 tplist-bpfcc
-rwxr-xr-x 1 root root 17766 Mar 27 2018 tcptracer-bpfcc
-rwxr-xr-x 1 root root 9327 Mar 27 2018 tcptop-bpfcc
-rwxr-xr-x 1 root root 5631 Mar 27 2018 tcpretrans-bpfcc
-rwxr-xr-x 1 root root 11996 Mar 27 2018 tcplife-bpfcc
-rwxr-xr-x 1 root root 6858 Mar 27 2018 tcpconnlat-bpfcc
-rwxr-xr-x 1 root root 6963 Mar 27 2018 tcpconnect-bpfcc
-rwxr-xr-x 1 root root 5782 Mar 27 2018 tcpaccept-bpfcc
-rwxr-xr-x 1 root root 12809 Mar 27 2018 syscount-bpfcc
-rwxr-xr-x 1 root root 1231 Mar 27 2018 syncsnoop-bpfcc
-rwxr-xr-x 1 root root 4560 Mar 27 2018 statsnoop-bpfcc
-rwxr-xr-x 1 root root 15860 Mar 27 2018 stackcount-bpfcc
-rwxr-xr-x 1 root root 6244 Mar 27 2018 sslsniff-bpfcc
-rwxr-xr-x 1 root root 6277 Mar 27 2018 solisten-bpfcc
-rwxr-xr-x 1 root root 4048 Mar 27 2018 softirqs-bpfcc
-rwxr-xr-x 1 root root 3409 Mar 27 2018 slabratetop-bpfcc
-rwxr-xr-x 1 root root 5643 Mar 27 2018 runqlen-bpfcc
-rwxr-xr-x 1 root root 5998 Mar 27 2018 runqlat-bpfcc
-rwxr-xr-x 1 root root 58 Mar 27 2018 rubystat-bpfcc
-rwxr-xr-x 1 root root 60 Mar 27 2018 rubyobjnew-bpfcc
-rwxr-xr-x 1 root root 56 Mar 27 2018 rubygc-bpfcc
-rwxr-xr-x 1 root root 58 Mar 27 2018 rubyflow-bpfcc
-rwxr-xr-x 1 root root 59 Mar 27 2018 rubycalls-bpfcc
-rwxr-xr-x 1 root root 60 Mar 27 2018 pythonstat-bpfcc
-rwxr-xr-x 1 root root 58 Mar 27 2018 pythongc-bpfcc
-rwxr-xr-x 1 root root 60 Mar 27 2018 pythonflow-bpfcc
-rwxr-xr-x 1 root root 61 Mar 27 2018 pythoncalls-bpfcc
-rwxr-xr-x 1 root root 9831 Mar 27 2018 profile-bpfcc
-rwxr-xr-x 1 root root 1139 Mar 27 2018 pidpersec-bpfcc
-rwxr-xr-x 1 root root 57 Mar 27 2018 phpstat-bpfcc
-rwxr-xr-x 1 root root 57 Mar 27 2018 phpflow-bpfcc
-rwxr-xr-x 1 root root 58 Mar 27 2018 phpcalls-bpfcc
-rwxr-xr-x 1 root root 4858 Mar 27 2018 opensnoop-bpfcc
-rwxr-xr-x 1 root root 2337 Mar 27 2018 oomkill-bpfcc
-rwxr-xr-x 1 root root 11141 Mar 27 2018 offwaketime-bpfcc
-rwxr-xr-x 1 root root 10464 Mar 27 2018 offcputime-bpfcc
-rwxr-xr-x 1 root root 58 Mar 27 2018 nodestat-bpfcc
-rwxr-xr-x 1 root root 56 Mar 27 2018 nodegc-bpfcc
-rwxr-xr-x 1 root root 9289 Mar 27 2018 nfsslower-bpfcc
-rwxr-xr-x 1 root root 4587 Mar 27 2018 nfsdist-bpfcc
-rwxr-xr-x 1 root root 3221 Mar 27 2018 mysqld_qslower-bpfcc
-rwxr-xr-x 1 root root 12023 Mar 27 2018 mountsnoop-bpfcc
-rwxr-xr-x 1 root root 17963 Mar 27 2018 memleak-bpfcc
-rwxr-xr-x 1 root root 2262 Mar 27 2018 mdflush-bpfcc
-rwxr-xr-x 1 root root 3429 Mar 27 2018 llcstat-bpfcc
-rwxr-xr-x 1 root root 3295 Mar 27 2018 killsnoop-bpfcc
-rwxr-xr-x 1 root root 61 Mar 27 2018 javathreads-bpfcc
-rwxr-xr-x 1 root root 58 Mar 27 2018 javastat-bpfcc
-rwxr-xr-x 1 root root 60 Mar 27 2018 javaobjnew-bpfcc
-rwxr-xr-x 1 root root 56 Mar 27 2018 javagc-bpfcc
-rwxr-xr-x 1 root root 58 Mar 27 2018 javaflow-bpfcc
-rwxr-xr-x 1 root root 59 Mar 27 2018 javacalls-bpfcc
-rwxr-xr-x 1 root root 5154 Mar 27 2018 hardirqs-bpfcc
-rwxr-xr-x 1 root root 3852 Mar 27 2018 gethostlatency-bpfcc
-rwxr-xr-x 1 root root 7124 Mar 27 2018 funcslower-bpfcc
-rwxr-xr-x 1 root root 7442 Mar 27 2018 funclatency-bpfcc
-rwxr-xr-x 1 root root 12448 Mar 27 2018 funccount-bpfcc
-rwxr-xr-x 1 root root 5847 Mar 27 2018 filetop-bpfcc
-rwxr-xr-x 1 root root 7235 Mar 27 2018 fileslower-bpfcc
-rwxr-xr-x 1 root root 3718 Mar 27 2018 filelife-bpfcc
-rwxr-xr-x 1 root root 9605 Mar 27 2018 ext4slower-bpfcc
-rwxr-xr-x 1 root root 5674 Mar 27 2018 ext4dist-bpfcc
-rwxr-xr-x 1 root root 5944 Mar 27 2018 execsnoop-bpfcc
-rwxr-xr-x 1 root root 20036 Mar 27 2018 deadlock_detector-bpfcc
-rwxr-xr-x 1 root root 3920 Mar 27 2018 dcstat-bpfcc
-rwxr-xr-x 1 root root 4009 Mar 27 2018 dcsnoop-bpfcc
-rwxr-xr-x 1 root root 3780 Mar 27 2018 dbstat-bpfcc
-rwxr-xr-x 1 root root 7130 Mar 27 2018 dbslower-bpfcc
-rwxr-xr-x 1 root root 12614 Mar 27 2018 cpuunclaimed-bpfcc
-rwxr-xr-x 1 root root 4975 Mar 27 2018 cpudist-bpfcc
-rwxr-xr-x 1 root root 57 Mar 27 2018 cobjnew-bpfcc
-rwxr-xr-x 1 root root 4142 Mar 27 2018 capable-bpfcc
-rwxr-xr-x 1 root root 6960 Mar 27 2018 cachetop-bpfcc
-rwxr-xr-x 1 root root 4932 Mar 27 2018 cachestat-bpfcc
-rwxr-xr-x 1 root root 9887 Mar 27 2018 btrfsslower-bpfcc
-rwxr-xr-x 1 root root 6214 Mar 27 2018 btrfsdist-bpfcc
-rwxr-xr-x 1 root root 2392 Mar 27 2018 bpflist-bpfcc
-rwxr-xr-x 1 root root 1721 Mar 27 2018 bitesize-bpfcc
-rwxr-xr-x 1 root root 6171 Mar 27 2018 biotop-bpfcc
-rwxr-xr-x 1 root root 4869 Mar 27 2018 biosnoop-bpfcc
-rwxr-xr-x 1 root root 4023 Mar 27 2018 biolatency-bpfcc
-rwxr-xr-x 1 root root 1567 Mar 27 2018 bashreadline-bpfcc
-rwxr-xr-x 1 root root 33534 Mar 27 2018 argdist-bpfcc
vagrant@ubuntu-bionic:~$
So I just created an empty repo and started working on it:
$ git clone https://github.com/thomarite/test-ci.git

$ cd test-ci
$ pyenv local 3.7.3
$ python -m venv virt_env
$ source virt_env/bin/active

$ python -m pip install pylama
$ python -m pip install black
$ python -m pip install pytest
$ python -m pip install tox

$ mkdir tests

$ vim tests/test_sample.py
def increment(x):
return x + 1


def test_answer():
assert increment(4) == 5

$ vim requirements.txt
pytest==5.4.3
pylama==7.7.1
black==19.10b0

$ vim .travis.yml
language: python
python:
"3.7"
# command to install dependencies
install:
pip install -r requirements.txt
# command to run tests
script:
pylama .
black --check .
py.test -s -v tests/
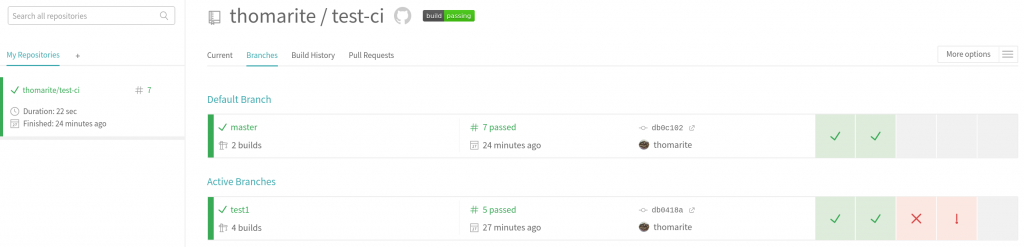
Then you create an account with Travis-ci.org that is “free” and you link up to your repo. As soon as you commit, you will how the tests run and if they are successful.
As I have now a basic setup, I hope I carry on using it to any new python stuff I try.
I have a supplier at my employer that requires to use a FTP server to send big files when you open a support ticket. For a long time (a couple of years) whenever I had to upload big files, I had to use my personal VM because my ftp connections failed from the office. I always blamed the super-smart firewall.
One day, I decided to fix the issue and allow the connection in our corporate firewall. I failed. Still couldnt upload files from the office. So keep using my personal VM.
This week I had to upload again a big file. This time I am working from home, so pretty much it is going to work the upload. Wrong! It fails. Ok, I checked a bit and got to the conclusion that it is my ISP or modem at home that is blocking FTP. Most ISP use CGN to stretch as much as possible the limited IPv4. I have IPv6 at home and my VM has IPv6 too… but the ftp server doesnt.
I checked the internet if there was any know issue with my ISP and FTP connections. No luck. I connected to my modem, nothing obvious messing around with FTP.
I decided to give it a proper go to this issue. I knew that it worked from my VM and it didnt from home. I noticed that I was running the same ftp client version in the VM and at home. So let’s debug the ftp client and take a packet capture in both locations.
CLI from the VM:
$ ftp -vd b.b.b.b
ftp: setsockopt: Bad file descriptor
Name: ftp
---> USER ftp
331 Please specify the password.
Password:
---> PASS XXXX
230 Login successful.
---> SYST
215 UNIX Type: L8
Remote system type is UNIX.
Using binary mode to transfer files.
ftp> cd support
---> CWD support
250 Directory successfully changed.
ftp> cd 211211
---> CWD 211211
250 Directory successfully changed.
ftp> put TEST.txt
local: TEST.txt remote: TEST.txt
---> TYPE I
200 Switching to Binary mode.
ftp: setsockopt (ignored): Permission denied
---> PORT a,a,a,a,162,57
200 PORT command successful. Consider using PASV.
---> STOR TEST.txt
150 Ok to send data.
226 Transfer complete.
28 bytes sent in 0.00 secs (854.4922 kB/s)
ftp> quit
---> QUIT
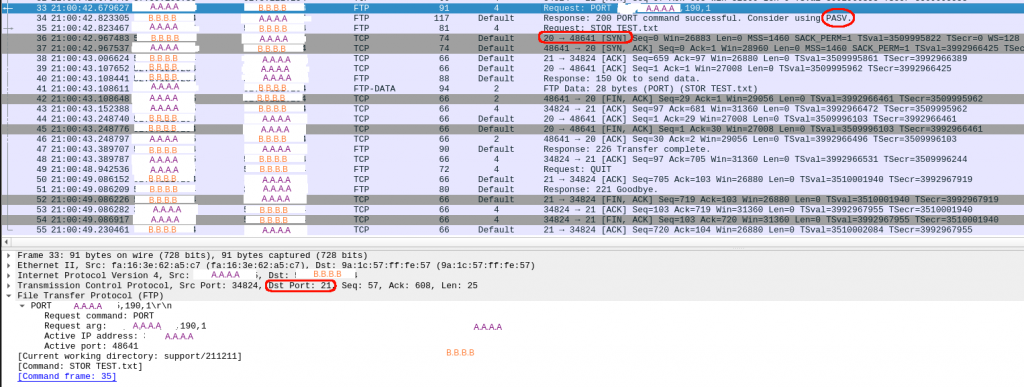
And this is the packet capture:
After typing “put” in packet 33, I see a “PASV” message from the server and a new connection (initiated by the server!) is established for the data transfer. All good.
So now, make the same from home and compare.
CLI from home without debug:
$ ftp b.b.b.b
Connected to b.b.b.b.
Name: ftp
331 Please specify the password.
Password:
230 Login successful.
Remote system type is UNIX.
Using binary mode to transfer files.
ftp> cd support
250 Directory successfully changed.
ftp> cd 211211
250 Directory successfully changed.
ftp> put TEST.txt
local: TEST.txt remote: TEST.txt
500 Illegal PORT command.
ftp: bind: Address already in use
ftp> quit
221 Goodbye.
CLI from home with debug:
$ ftp -vd b.b.b.b
ftp: setsockopt: Bad file descriptor
Name: ftp
---> USER ftp
331 Please specify the password.
Password:
---> PASS XXXX
230 Login successful.
---> SYST
215 UNIX Type: L8
Remote system type is UNIX.
Using binary mode to transfer files.
ftp> cd support
---> CWD support
250 Directory successfully changed.
ftp> cd 211211
---> CWD 211211
250 Directory successfully changed.
ftp> put TEST.txt
local: TEST.txt remote: TEST.txt
---> TYPE I
200 Switching to Binary mode.
ftp: setsockopt (ignored): Permission denied
---> PORT 192,168,1,158,202,145
500 Illegal PORT command.
ftp: bind: Address already in use
ftp> quit
---> QUIT
221 Goodbye.
So with and without debug I keep seeing “ftp: bind: Address already in use”…..
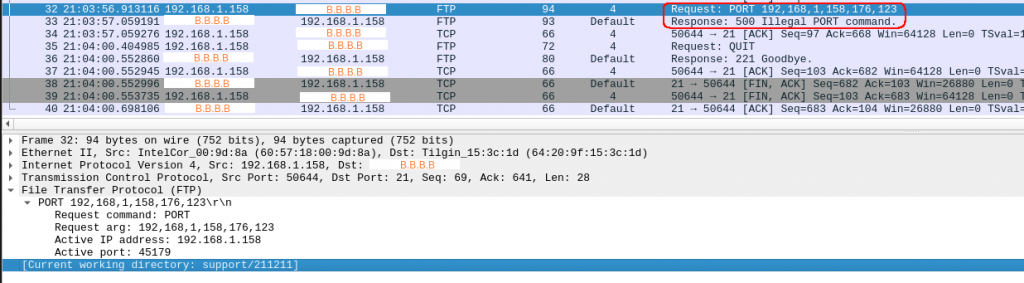
And this is the packet capture from home:
So after I type “put” in packet 32, the answer from the server is a “500”.
I wasnt clearly paying attention to the clues. I was still banging my head why the server was sending a “500 Ilegal PORT command”.
I was comparing both captures and both debug outputs… but still didnt it.
I thought I understood FTP. I knew that you use port TCP 21 to establish the control session and the data session / transfer is via new TCP session using a random port. That’s one of the reasons that using NAT or CGN can screw up your FTP sessions.
So I assumed that the issues wasnt my ISP. So it had to be my side (or me).
So finally, I decided to search for “ftp: bind: Address already in use” as it was the message that came up with and without debugging.
An entry from 2004…. it can’t fix my problem for sure…. keep reading and update from 2020… it says it works…. oh boy II
try using a passive connection with "ftp -p" instead, see if it helps...
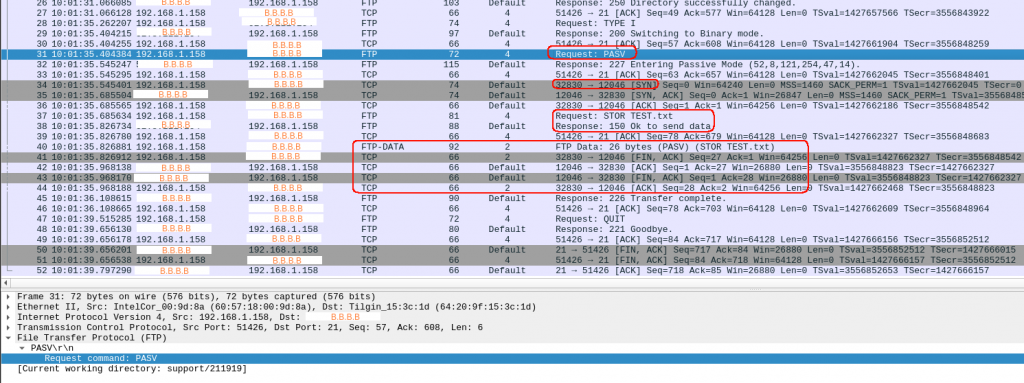
There we go:
$ ftp -vdp b.b.b.b
ftp: setsockopt: Bad file descriptor
Name: ftp
---> USER ftp
331 Please specify the password.
Password:
---> PASS XXXX
230 Login successful.
---> SYST
215 UNIX Type: L8
Remote system type is UNIX.
Using binary mode to transfer files.
ftp> cd support
---> CWD support
250 Directory successfully changed.
ftp> cd 211211
---> CWD 211211
250 Directory successfully changed.
ftp> put TEST.txt
local: TEST.txt remote: TEST.txt
---> TYPE I
200 Switching to Binary mode.
ftp: setsockopt (ignored): Permission denied
---> PASV
227 Entering Passive Mode (b,b,b,b,46,248).
---> STOR TEST.txt
150 Ok to send data.
226 Transfer complete.
26 bytes sent in 0.00 secs (12.5386 kB/s)
ftp> quit
---> QUIT
221 Goodbye.
it worked !!!
I felt embarrassed. Time to search for FTP passive vs active…
Really good explanation. I hope I will never forget it.
FTP Active: The client issues a PORT command to the server signalling that it will “actively” provide an IP and port number so the server opens the Data Connection back to the client.
FTP Passive: The client issues a PASV command to indicate that it will wait “passively” for the server to supply an IP and port number, after which the client opens a Data Connection to the server.
So it worked in my VM because somehow the ftp server sent a PASV command (maybe because it detects there is no NAT as I have a public IP???).
From home, it failed because, by default, the connection is ftp active, so when the server tried to open the new data connection to me(something I couldnt see in the packet capture…) it failed as my ADSL modem wouldnt allow inbound connections.
Once I enabled “-p” in my connection to the server, all worked because it was me who started the new data connection and my firewall allows everything outbound.
Happy to solve the problem after a couple of years, and after a couple of hours of “serious” troubleshooting. It was shocking how blind I was. I had the ftp error message and the PASV from the trace.
I am troubleshooting an issue in a docker setup with some Arista cEOS where I can’t ping inside a VRF. First I though it was a MTU issue as when you use MPLS, there is an extra tag in the L2 frame.
…But my pings weren’t that big.
Still wanted to increase the MTU because that’s the expected thing to do in your WAN links if you run MPLS and want your users in different VRFs to be able to use the full 1500 bytes.
After some searching, It seems you can change the default value using the config file as per this link:
$ ip link show docker0
9: docker0: mtu 1500 qdisc noqueue state DOWN mode DEFAULT group default
link/ether 02:42:be:73:8c:d3 brd ff:ff:ff:ff:ff:ff
$ cat /etc/docker/daemon.json
{
"data-root": "/home/somebody/storage/docker",
"mtu": 1600
}
$ sudo service docker restart
..
$ ip link show docker0
9: docker0: mtu 1500 qdisc noqueue state DOWN mode DEFAULT group default
link/ether 02:42:fb:c0:cf:a2 brd ff:ff:ff:ff:ff:ff
And restart docker. But still had mtu 1500. Checking another link it seems I actually need to create a container so the bridge come up with the new value
$ docker run -d busybox top
...
9: docker0: mtu 1600 qdisc noqueue state UP mode DEFAULT group default
link/ether 02:42:fb:c0:cf:a2 brd ff:ff:ff:ff:ff:ff
Funny thing, once I started my lab again (using docker-topo) still got MTU 1500!!!
Will have to dig a bit why docker-topo doesnt take the docker mtu 1600 from the config file.
Solution: docker-topo is creating user-defined bridges, so it needs to be told that the mtu is different. The “mtu:1600” in the docker config it is only for the default bridge so when you start the busybox, it is attached to the default bridge and you see 1600.
The other thing I was curious was if I could tcpdump the networks created by docker.
Yes, you can!
# docker network ls

# ifconfig

# tcpdump -i br-xxxx
This week Job Snijders advertised the latest version of openbsd. I have been always a dreamer of being a hacker (like the movies) and the best guys when I was in Uni were Linux users. I had no idea what Linux/Unix/BSD was at that time. At the end (by the 4th year in Uni) I managed to install Linux in my windows PC without destroying anything. And fortunately, I have been using it since then. Learning more and still fortunately, in the last 6 years, using it everyday at work too.
Still very very far away from being a hacker though 🙂
In this time, I have read a bit about the BSD vs Linux threads about licenses, security, etc. And actually I was always keen to learn a bit. In Motorola, I had to use Solaris (even managed to get a certification!).
So this week, I tried to setup a VM in my debian laptop for using OpenBSD 6.7
I found and followed this link, so all credits for the author.
First I downloaded openbsd 6.7 (install67.iso) from here. There are many mirrors around the world. Prepare the file:
/var/lib/libvirt/images# ls -ltr
total 1386064
-rwxr--r-- 1 libvirt-qemu libvirt-qemu 996671488 Apr 6 2018 debian-VAGRANTSLASH-stretch64_vagrant_box_image_9.1.0.img
-rwxr--r-- 1 libvirt-qemu libvirt-qemu 950796288 Nov 29 23:17 centos-VAGRANTSLASH-7_vagrant_box_image_1905.1.img
-rw-r--r-- 1 ss ss 470118400 May 21 23:23 install67.iso
root@athens:/var/lib/libvirt/images# chown libvirt-qemu.libvirt-qemu install67.iso
/var/lib/libvirt/images# mv install67.iso openbsd67.iso
Something that confused my was that I was installing openbsd6.7 but the os-variant in the command must be obenbsd5.8. Anything else, fails.
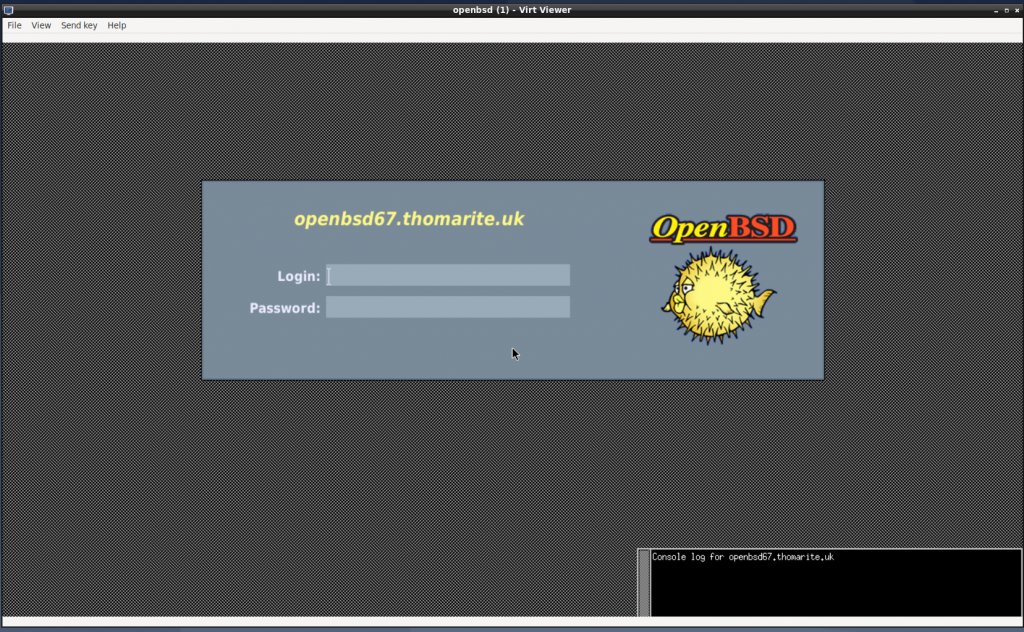
In my setup, I have virt-viewer installed so it opened up and finished the installation using that.
I was surprised how quick was everything and didnt find any problem:
Once I logged in, I felt useless 🙂 I used a bit the shell and tested I could ssh from my host pc to the openbsd vm.
So now, I can find a book of openbsd for dummies and get going!
So close virt-viewer and stop the VM:
/var/lib/libvirt/images# virsh
virsh # list
Id Name State
2 openbsd running
virsh #
virsh #
virsh # destroy openbsd
Domain openbsd destroyed
virsh # list
Id Name State
virsh #
virsh # list --all
Id Name State
openbsd shut off
virsh #
Test we can start up again:
# virsh
Welcome to virsh, the virtualisation interactive terminal.
Type: 'help' for help with commands
'quit' to quit
virsh # list --all
Id Name State
openbsd shut off
virsh # start openbsd
Domain openbsd started
virsh # list --all
Id Name State
3 openbsd running
virsh # exit
#
# virt-viewer
I think the only thing I miss from Microsoft Windows, it is “paint”. I can’t find anything in Linux that is simple and reliable. I have used pinta, gimp and others but they break or they are too pro.
So, if you have internet connection. This is your friend
And if you want something a bit more pro like Visio, then this one
I recommend both a lot!
I know you have GIMP, but I just a simple tool to draw red squares!
Today I have had “fun” troubleshooting an issue that looked easy at first sight. A colleague was trying to PXE boot some server from a network that we haven’t used for a while.
When the server boots up, asks for an IP via DHCP. As we have a centralized DHCP server infrastructure, we have configured DHCP relay in the firewall facing that server to send that request to the DHCP server.
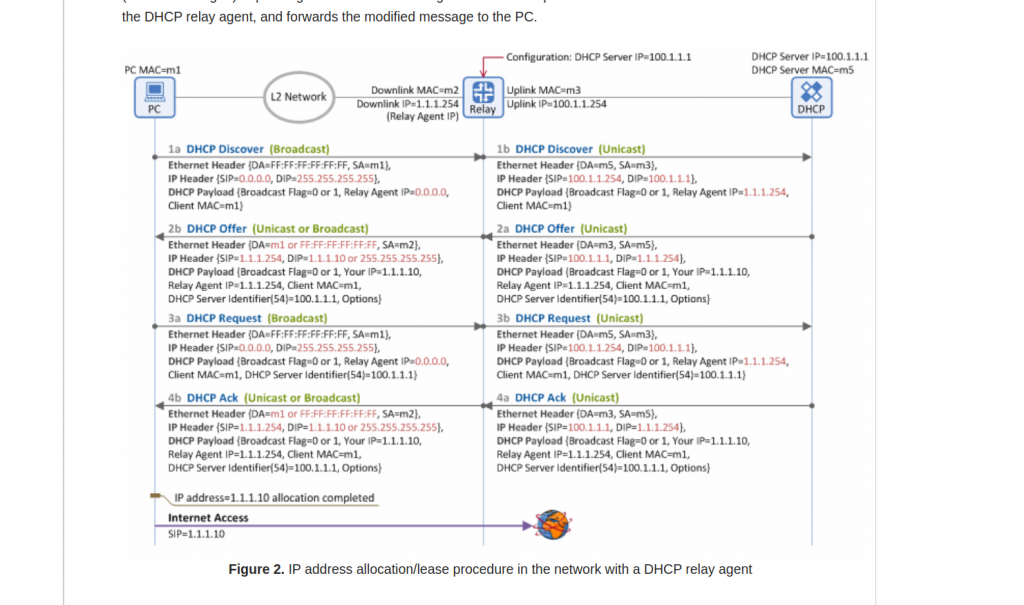
First, let’s take a look at how DHCP relay works. This is a very good link. And this diagram from the mentioned link it is really useful:
One think I learned is the reply (DCHP Offer) doesnt have to use as destination IP the same IP it received as source in DHCP Discover. In the picture, it is packet 2a.
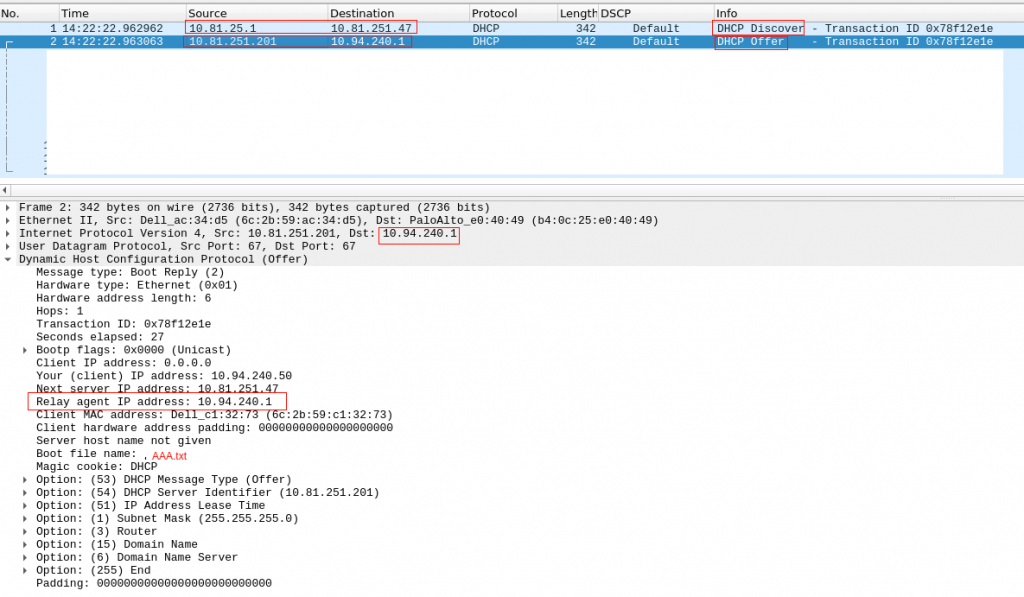
Checking in our environment, we confirm that:
Our server is in 10.94.240.x network. Our firewall is acting as DHCP relay, and send the DHCP Discovery (unicast) to our VIP DHCP Server IP.
The DHCP offer, uses as source the physical IP of the DHCP server and destination is the DHCP relay IP (so it is 10.94.240.1 – the firewall IP in 10.94.240.x network)
Ok, so everything looks fine? No really. The server receives the query, it answers… but we dont see a DCHP Request/ACK.
BTW, keep in mind that DHCP is UDP….
So, we need to see where the packets are lost.
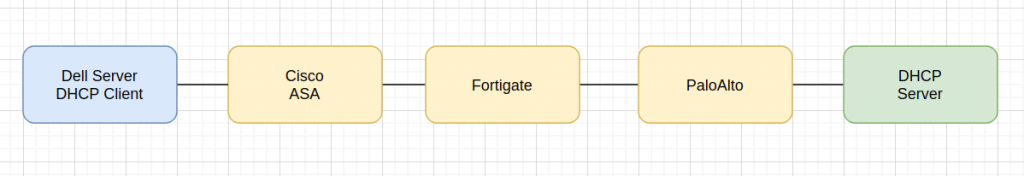
This is a high level path flow between the client and server:
So we need to check this connection is three different firewall vendors….
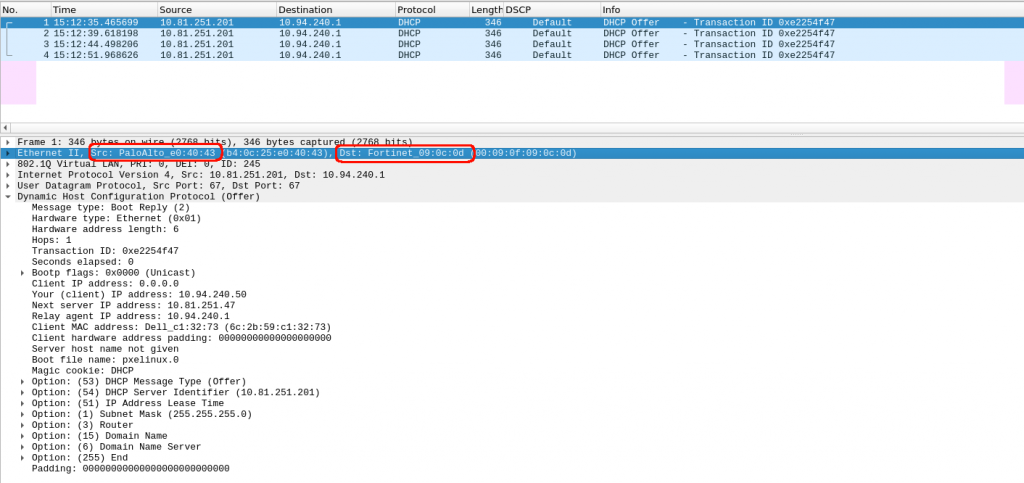
The initial troubleshooting was just using the GUI tools from Palo/Fortigate. We couldn see anything…. but the server was constantly receiving DHCP Discover and sending DHCP Offer… I dont get it:
# tcpdump -i X udp port 67 or 66 -nn

14:58:06.969462 IP 10.81.25.1.67 > 10.81.251.47.67: BOOTP/DHCP, Request from 6c:2b:59:c1:32:73, length 300
14:58:06.969564 IP 10.81.251.201.67 > 10.94.240.1.67: BOOTP/DHCP, Reply, length 300

14:58:28.329048 IP 10.81.25.1.67 > 10.81.251.47.67: BOOTP/DHCP, Request from 6c:2b:59:c1:32:73, length 300
14:58:28.329157 IP 10.81.251.201.67 > 10.94.240.1.67: BOOTP/DHCP, Reply, length 300
Initially it took me a while to see the request/reply because I was assuming the dhcp request had source 10.94.240.1. So I was seeing only the Reply but not the Request. That was when I went to clarify my head about DHCP Relay and found the link.
So ok, we have the DHCP Request/Reply, but absolutely nothing in the Palo. Is the palo dropping the packets or is forwarding? No idea. The GUI says nothing, I took a packet capture and couldnt see that traffic neither…
Doesnt makes sense.
Let’s get back to basic.
Did I mention DHCP is UDP? So how a next generation firewall (like paloalto) with all the fancy features enable (we have nearly all of them enable…) treats a UDP connection? UDP is stateless… but the firewall is statefull… the firewall creates a flow with the first packet so it can track, any new packet is considered part of that flow. But why we dont see the flows? We actually have only one flow. The firewall has created that session and offloaded to hardware. So you dont see anything else in the control-plane / GUI. The GUI only shows the end of a connection/flow. And as our flow DHCP Relay hasnt’ terminated (it is UDP) and the firewall keeps receiving packets, it is considered life (the firewall doesnt really know what is going on). So for that reason we dont see the connection in the PaloUI. Ok, I got to that point after a while…. I need to proof that the packet from the server is reaching the firewall and it is leaving it too.
How can I do that? Well, I need to delete that flow so the firewall considers a new connection and the tcpdump can see the packets.
This is the a good link from paloalto to take captures. So I found my connection and the cleared it:
palo(active)> show session all filter destination 10.94.240.1

ID Application State Type Flag Src[Sport]/Zone/Proto (translated IP[Port])
Vsys Dst[Dport]/Zone (translated IP[Port])
135493 dhcp ACTIVE FLOW 10.81.251.201[67]/ZONE1/17 (10.81.251.201[67])
vsys1 10.94.240.1[67]/ZONE2 (10.94.240.1[67])
palo(active)>
palo(active)> clear session id 135493
And now, my packet capture in paloalto confirms that it is sending the packet to the next firewall (checking the destination MAC) !!!
Ok, so we confirm the first firewall in the return path was fine…. next one, it is fortigate.
BTW, we were checked and assumed that the routing is fine in all routers, firewalls, etc. Sometimes is not the case… so when things dont follow your thoughts, get back to the very basics….
We have exactly the same issue as in PaloAlto. I can’t see anything in the logs about receiving a dhcp offer from palo and forwarding it to the last firewall Cisco.
And again, we apply the same reasoning. We have an UDP connection, we have a next-generation firewall (with fancy ASIC). And one more thing, in this fortigate firewall, we allow intra-zone traffic, so it is not going to show anyway in the GUI monitor…
Fantastic, we have confirmation that the second firewall receives and forwards the DHCP Reply!!!
Ok, now the last stop, Cisco ASA. This is an old firewall, I think it could be my father or Darth Vader.
I dont have the fancy tools for packet capture like Palo/Fortigate…. so I went to the basic “debug” commands and “packet-tracer”.
First, this was the dhcp config in Cisco:
vader/pri/act# show run | i dhcp
dhcprelay server 10.81.251.47 EGRESS
dhcprelay enable SERVERS-ZONE
dhcprelay timeout 60
And, the ACL allows all IP traffic in those interfaces… and couldnt see any deny in the logs.
So, I enabled all debugging things I could find for dhcp:
vader/pri/act# show debug
debug dhcpc detail enabled at level 1
debug dhcpc error enabled at level 1
debug dhcpc packet enabled at level 1
debug dhcpd packet enabled at level 1
debug dhcpd event enabled at level 1
debug dhcpd ddns enabled at level 1
debug dhcprelay error enabled at level 1
debug dhcprelay packet enabled at level 1
debug dhcprelay event enabled at level 200
vader/pri/act# DHCPD: Relay msg received, fip=ANY, fport=0 on SERVERS-ZONE interface
DHCPRA: relay binding found for client f48e.38c7.1b6e.
DHCPD: setting giaddr to 10.94.240.1.
dhcpd_forward_request: request from f48e.38c7.1b6e forwarded to 10.81.251.47.
DHCPD: Relay msg received, fip=ANY, fport=0 on SERVERS-ZONE interface
DHCPRA: relay binding found for client 6c2b.59c1.3273.
DHCPD: setting giaddr to 10.94.240.1.
dhcpd_forward_request: request from 6c2b.59c1.3273 forwarded to 10.81.251.47.
vader/pri/act#
So, the debugging doesnt says anything regarding the packet coming back from Fortigate… Not looking good I am afraid. I wasnt running out of ideas about debug commands. I coudn’t increase an log level neither….
Let’s give a go to packet tracer… doesnt looks good:
vader/pri/act# packet-tracer input EGRESS udp 10.81.251.201 67 10.94.240.1 67
Phase: 1
Type: ACCESS-LIST
Subtype:
Result: ALLOW
Config:
Implicit Rule
Additional Information:
MAC Access list
Phase: 2
Type: ACCESS-LIST
Subtype:
Result: DROP
Config:
Implicit Rule
Additional Information:
Result:
input-interface: EGRESS
input-status: up
input-line-status: up
Action: drop
Drop-reason: (acl-drop) Flow is denied by configured rule
So, we are sure our ACL is totally open but the firewall is dropping the packet coming from fortigate. Why? How to fix it?
Ok, get back to basics. Focus in Cisco config. It uses as DHCP relay server, 10.81.251.47 (VIP). But the DHCP reply is coming from the physical IP 10.81.251.201….. maybe Cisco doesnt like that…. Let’s try to add the physical IPs as a new DHCP server:
vader/pri/act# sri dhcp
dhcprelay server 10.81.251.47 EGRESS
dhcprelay server 10.81.251.201 EGRESS
dhcprelay server 10.81.251.202 EGRESS
I think I nearly cried after seeing this in the dhcp logs in our server:
May 12 16:16:27 dhcp1 dhcpd[2561]: DHCPDISCOVER from f4:8e:38:c7:1b:6e via 10.94.240.1
May 12 16:16:28 dhcp1 dhcpd[2561]: DHCPOFFER on 10.94.240.50 to f4:8e:38:c7:1b:6e (cmc-111) via 10.94.240.1
May 12 16:16:28 dhcp1 dhcpd[2561]: Wrote 0 class decls to leases file.
May 12 16:16:28 dhcp1 dhcpd[2561]: Wrote 0 deleted host decls to leases file.
May 12 16:16:28 dhcp1 dhcpd[2561]: Wrote 0 new dynamic host decls to leases file.
May 12 16:16:28 dhcp1 dhcpd[2561]: Wrote 1 leases to leases file.
May 12 16:16:28 dhcp1 dhcpd[2561]: DHCPREQUEST for 10.94.240.50 (10.81.251.202) from f4:8e:38:c7:1b:6e (cmc-111) via 10.94.240.1
May 12 16:16:28 dhcp1 dhcpd[2561]: DHCPACK on 10.94.240.50 to f4:8e:38:c7:1b:6e (cmc-111) via 10.94.240.1
So at the end, finally fixed…. it took too many hours.
Notes:
DHCP Realy: It is not that obvious the flow regarding IPs.
UDP and firewalls, debugging it is a bit more challenging.
Cisco ASA dhcprelay server IPs…. VIPs and non-VIPs please.
Another issue I had during the weekend that took me hours. Thanks that I have been reading a bit this book (1.6) and had some clues.
I was trying to test a repo to start an Arista lab using docker and I assumed that everything should work if I followed the instructions. My problem was the script trying to push some basic config to the switches.
As you can see that differs with what we have inside the bash script. So from the bash script we need to put between ‘ the parameter for -c but inside the parameter we need to use “. So I had to make the change below:
-  docker exec "${1}" bash -c "echo -e ${commands} | FastCli -p15 -e"
+  # need to update this command as the quoting doesnt work in my bash
+  docker exec "${1}" bash -c 'echo -e '"'${commands}'"' | FastCli -p15 -e'
The books says Enclose a string in single quotes ‘ unless it contains elements that you want the shell to interpolate. So let’s divide the solution in parts so can be easier to digest (and remember for me in the future because this will bit me again for sure)
1st part: ‘echo -e ‘
2nd part: “
3rd part: ‘${commands}’
4th part: “
5th part: ‘ | FastCli -p15 -e’
The ” need to be outside the ‘ region because the commands need to be between ” for the docker command. The 3rd part will expand the variable commands.
I guess the author is using a different version of bash? This is mine
$ bash --version
GNU bash, version 5.0.16(1)-release (x86_64-pc-linux-gnu)
Copyright (C) 2019 Free Software Foundation, Inc.
License GPLv3+: GNU GPL version 3 or later

This is free software; you are free to change and redistribute it.