Reading this blog entry I realised that very likely I have never tried forward tcpdump to a wireshark. How many times I have taken a pcap in a switch and then I need to download to see the details in wireshark…
I guess you can find some blocking points in firewalls (at least for 2-steps option)
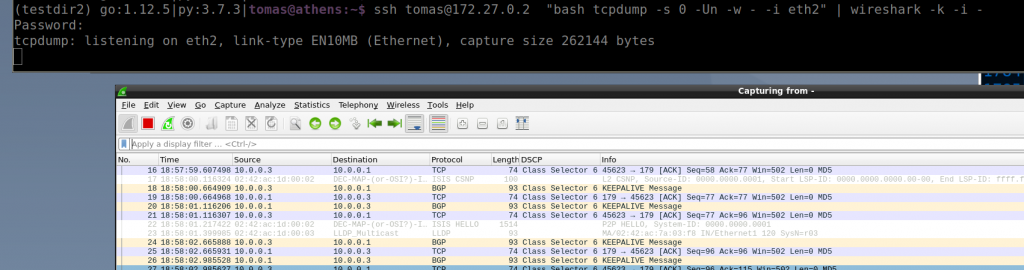
So I tried the single command with a switch in my ceoslab and it works!
The ssh command is actually executing the “bash tcpdump…” remotely. But the key is the “-U” and “-w -” flags. “-U” in conjunction with “-w” sends the packet without waiting for the buffer to fill. Then “-w -” says that it writes the output to stdout instead of a file. If you run the command without -U, it would work but it will update a bit slower as it needs to fill the buffers.
From tcpdump manual:
       -U
       --packet-buffered
              If the -w option is not specified, make the printed packet output ``packet-buffered''; i.e., as the description of the contents of each packet is printed, it will be written to the standard  output,  rather  than, when not writing to a terminal, being written only when the output buffer fills.

              If  the  -w  option  is  specified, make the saved raw packet output ``packet-buffered''; i.e., as each packet is saved, it will be written to the output file, rather than being written only when the output buffer fills.

              The -U flag will not be supported if tcpdump was built with an older version of libpcap that lacks the pcap_dump_flush() function.

......
   -w file
          Write the raw packets to file rather than parsing and printing them out.  They can later be printed with the -r option.  Standard output is used if file is ``-''.

          This  output will be buffered if written to a file or pipe, so a program reading from the file or pipe may not see packets for an arbitrary amount of time after they are received.  Use the -U flag to cause packets to be written as soon as they are received.
And the stdout of that process is the ssh command so we redirect that outout via a pipe “|” and it is sent as input for wireshark thanks to “-i -” that makes wireshark to read from stdin (that is the stdout from the tcpdump in the switch!)
The wireshark manual:
       -i|--interface  <capture interface>|-
           Set the name of the network interface or pipe to use for live packet capture.

           Network interface names should match one of the names listed in "wireshark -D" (described above); a number, as reported by "wireshark -D", can also be used.  If you're using UNIX, "netstat -i", "ifconfig -a" or "ip link" might also work to list interface names, although not all versions of UNIX support the -a flag to ifconfig.

           If no interface is specified, Wireshark searches the list of interfaces, choosing the first non-loopback interface if there are any non-loopback interfaces, and choosing the first loopback interface if there are no non-loopback interfaces.  If there are no interfaces at all, Wireshark reports an error and doesn't start the capture.

           Pipe names should be either the name of a FIFO (named pipe) or "-" to read data from the standard input.  On Windows systems, pipe names must be of the form "\\pipe\.\pipename".  Data read from pipes must be in standard pcapng or pcap format. Pcapng data must have the same endianness as the capturing host.

           This option can occur multiple times. When capturing from multiple interfaces, the capture file will be saved in pcapng format.

....

       -k  Start the capture session immediately.  If the -i flag was specified, the capture uses the specified interface.  Otherwise, Wireshark searches the list of interfaces, choosing the first non-loopback interface if
           there are any non-loopback interfaces, and choosing the first loopback interface if there are no non-loopback interfaces; if there are no interfaces, Wireshark reports an error and doesn't start the capture.
The two-steps option relies on “nc” to send/receive the data, but it is the same idea regarding the tcpdump/wireshark flags using “-“
$ sudo modprobe bonding
$ ip link help bond
$ sudo ip link add bond0 type bond mode 802.3ad
$ sudo ip link set eth0 master bond0
$ sudo ip link set eth1 master bond0
Bridging: vlans + trunks
ip neigh show // l2 table
ip route show // l3 table

ip route add default via 192.168.1.1 dev eth1

sudo modprobe 8021q

// create bridge and add links to bridge (switch)
sudo ip link add br0 type bridge vlan_filtering 1 // native vlan = 1
sudo ip link set eth1 master br0
sudo ip link set eth2 master br0
sudo ip link set eth3 master br0

// make eth1 access port for v11
sudo bridge vlan add dev eth1 vid 11 pvid untagged

// make eth3 access port for v12
sudo bridge vlan add dev eth3 vid 12 pvid untagged

// make eth2 trunk port for v11 and v12
sudo bridge vlan add dev eth2 vid 11
sudo bridge vlan add dev eth2 vid 12

// enable bridge and links
sudo ip link set up dev br0
sudo ip link set up dev eth1
sudo ip link set up dev eth2
sudo ip link set up dev eth3

bridge link show
bridge vlan show
bridge fdb show
VxLAN
I havent tried this yet:
Linux System 1
  sudo ip link add br0 type bridge vlan_filtering 1
  sudo ip link add vlan10 type vlan id 10 link bridge protocol none
  sudo ip addr add 10.0.0.1/24 dev vlan10
  sudo ip link add vtep10 type vxlan id 1010 local 10.1.0.1 remote 10.3.0.1 learning
  sudo ip link set eth1 master br0
  sudo bridge vlan add dev eth1 vid 10 pvid untagged

Linux System 2
  sudo ip link add br0 type bridge vlan_filtering 1
  sudo ip link add vlan10 type vlan id 10 link bridge protocol none
  sudo ip addr add 10.0.0.2/24 dev vlan10
  sudo ip link add vtep10 type vxlan id 1010 local 10.3.0.1 remote 10.1.0.1 learning
  sudo ip link set eth1 master br0
  sudo bridge vlan add dev eth1 vid 10 pvid untagged
This is something I wanted to try for some time. Normally for networks monitoring you use a NMS tool. They can be expensive, free or cheap. I have seen/used Observium and LibreNMS. And many years ago Cacti. There are other tools that can do the job like Zabbix/Nagios/Icinga.
But it seems time-series-databases are the new standard. They give you more flexibility as you can create queries and graph them.
I decided for InfluxDB-Telegraf-Grafana stuck as I could find quickly info based on scenarios of networks.
What is the rule of eachc one:
Telegraf: collect data InfluxDB: store data Grafana: visualize
My main source is again Anton’s blog. All credits to him.
Environment
My network is just 3 Arista ceos containers via docker. All services will run as containers so you need docker installed. Everything is IPv4.
InfluxDB
Installation:
// Create directories
mkdir telemetry-example/influxdb
cd telemetry-example/influxdb

// Get influxdb config
docker run --rm influxdb influxd config > influxdb.conf

// Create local data folder for influxdb that we will map
mkdir data
ls -ltr

// Check docker status
docker images
docker ps -a

// Create docker instance for influxdb. Keep in  mind that I am giving a name to the instance

docker run -d -p 8086:8086 -p 8088:8088 --name influxdb \
-v $PWD/influxdb.conf:/etc/influxdb/influxdb.conf:ro \
-v $PWD/data:/var/lib/influxdb \
influxdb -config /etc/influxdb/influxdb.conf

// Verify connectivity
curl -i http://localhost:8086/ping

// Create database "test" using http-query (link below for more details)
curl -XPOST http://localhost:8086/query --data-urlencode "q=CREATE DATABASE test"
{"results":[{"statement_id":0}]} <-- command was ok!

// Create user/pass for your db.
curl -XPOST http://localhost:8086/query --data-urlencode "q=CREATE USER xxx WITH PASSWORD 'xxx123' WITH ALL PRIVILEGES"
{"results":[{"statement_id":0}]} <-- command was ok!

// Create SSL cert for influxdb
docker exec -it influxdb openssl req -x509 -nodes -newkey rsa:2048 -keyout /etc/ssl/influxdb-selfsigned.key -out /etc/ssl/influxdb-selfsigned.crt -days 365 -subj "/C=GB/ST=LDN/L=LDN/O=domain.com/CN=influxdb.domain.com"

// Update influxdb.conf for SSL
telemetry-example/influxdb$ vim influxdb.conf
…
https-enabled = true
https-certificate = "/etc/ssl/influxdb-selfsigned.crt"
https-private-key = "/etc/ssl/influxdb-selfsigned.key"
…

// Restart influxdb to take the changes
docker restart influxdb

// Get influxdb IP for using it later
docker container inspect influxdb --format='{{ .NetworkSettings.IPAddress }}'
172.17.0.2

// Verify connectivity via https
curl -i https://localhost:8086/ping --insecure
The verification for HTTPS was a bit more difficult because the result was always correct no matter what query I was running:
So I decided to see if there was cli/shell for the influxdb (like in mysql, etc). And yes, there is one. Keep in mind that you have to use “-ssl -unsafeSsl” at the same time! That confused me a lot.
$ docker exec -it influxdb influx -ssl -unsafeSsl
Connected to https://localhost:8086 version 1.8.1
InfluxDB shell version: 1.8.1
> show databases
name: databases
name
_internal
test
> use test
Using database test
> show series
key
cpu,cpu=cpu-total,host=5f7aa2c5550e
Links about influxdb that are good for the docker creation and the http queries:
// Create dir
mkdir telemetry-example/telegraf
cd telemetry-example/telegraf

// Get config file to be modified
docker run --rm telegraf telegraf config > telegraf.conf

// Add the details of influxdb in telegraf.conf. As well, you need to add the devices you want to poll. In my case 172.23.0.2/3/4.

vim telegraf.conf
....
[[outputs.influxdb]]
urls = ["https://172.17.0.2:8086"]
database = "test"
skip_database_creation = false
## Timeout for HTTP messages.
timeout = "5s"
## HTTP Basic Auth
username = "xxx"
password = "xxx123"
## Use TLS but skip chain & host verification
insecure_skip_verify = true
# Retrieves SNMP values from remote agents
[[inputs.snmp]]
## Agent addresses to retrieve values from.
## example: agents = ["udp://127.0.0.1:161"]
## agents = ["tcp://127.0.0.1:161"]
agents = ["udp://172.23.0.2:161","udp://172.23.0.3:161","udp://172.23.0.4:161"]
#
## Timeout for each request.
timeout = "5s"
#
## SNMP version; can be 1, 2, or 3.
version = 2
#
## SNMP community string.
community = "tomas123"
#
## Number of retries to attempt.
retries = 3
This is the SNMP config I added below the SNMPv3 options in [[inputs.snmp]]
#   ## Add fields and tables defining the variables you wish to collect.  This
#   ## example collects the system uptime and interface variables.  Reference the
#   ## full plugin documentation for configuration details.

  [[inputs.snmp.field]]
    name = "hostname"
    oid = "RFC1213-MIB::sysName.0"
    is_tag = true

  [[inputs.snmp.field]]
    name = "uptime"
    oid = "DISMAN-EVENT-MIB::sysUpTimeInstance"

  # IF-MIB::ifTable contains counters on input and output traffic as well as errors and discards.
  [[inputs.snmp.table]]
    name = "interface"
    inherit_tags = [ "hostname" ]
    oid = "IF-MIB::ifTable"

    # Interface tag - used to identify interface in metrics database
    [[inputs.snmp.table.field]]
      name = "ifDescr"
      oid = "IF-MIB::ifDescr"
      is_tag = true

  # IF-MIB::ifXTable contains newer High Capacity (HC) counters that do not overflow as fast for a few of the ifTable counters
  [[inputs.snmp.table]]
    name = "interfaceX"
    inherit_tags = [ "hostname" ]
    oid = "IF-MIB::ifXTable"

    # Interface tag - used to identify interface in metrics database
    [[inputs.snmp.table.field]]
      name = "ifDescr"
      oid = "IF-MIB::ifDescr"
      is_tag = true

  # EtherLike-MIB::dot3StatsTable contains detailed ethernet-level information about what kind of errors have been logged on an interface (such as FCS error, frame too long, etc)
  [[inputs.snmp.table]]
    name = "interface"
    inherit_tags = [ "hostname" ]
    oid = "EtherLike-MIB::dot3StatsTable"

    # Interface tag - used to identify interface in metrics database
    [[inputs.snmp.table.field]]
      name = "name"
      oid = "IF-MIB::ifDescr"
      is_tag = true
For more info about the SNMP config in telegraf. These are good links. This is the official github page. And this is the page for SNMP input plugin that explain the differences between “field” and “table”.
As well, the link below is really good too for explaining the SNMP config in telegraf:”Gathering Data via SNMP”
docker logs telegraf -f
...
2020-07-17T12:45:10Z E! [inputs.snmp] Error in plugin: initializing table interface: translating: exit status 2: MIB search path: /root/.snmp/mibs:/usr/share/snmp/mibs:/usr/share/snmp/mibs/iana:/usr/share/snmp/mibs/ietf:/usr/share/mibs/site:/usr/share/snmp/mibs:/usr/share/mibs/iana:/usr/share/mibs/ietf:/usr/share/mibs/netsnmp
Cannot find module (EtherLike-MIB): At line 0 in (none)
EtherLike-MIB::dot3StatsTable: Unknown Object Identifier
...
You will see errors about not able to find the MIB files! So I used Librenms mibs. I download the project and copied the MIBS I thought I needed (arista and some other that dont belong to a vendor). As well, this is noted by Anton’s in this link:
I have seen Grafana before but I have never used it so the configuration on queries was a bit of a challenge but I was lucky and I found very good blogs for that. The installation process is ok:
// Create folder for grafana and data
mkdir -p telemetry-example/grafana/data
cd telemetry-example/grafana

// Create docker instance
docker run -d -p 3000:3000 --name grafana \
--user root \
-v $PWD/data:/var/lib/grafana \
grafana/grafana

// Create SSL cert for grafana
docker exec -it grafana openssl req -x509 -nodes -newkey rsa:2048 -keyout /etc/ssl/grafana-selfsigned.key -out /etc/ssl/grafana-selfsigned.crt -days 365 -subj "/C=GB/ST=LDN/L=LDN/O=domain.com/CN=grafana.domain.com"

// Copy grafana config so we can update it
docker cp grafana:/etc/grafana/grafana.ini grafana.ini

// Update grafana config with SSL
vim grafana.ini
############################## Server
[server]
# Protocol (http, https, h2, socket)
protocol = https
…
# https certs & key file
cert_file = /etc/ssl/grafana-selfsigned.crt
cert_key = /etc/ssl/grafana-selfsigned.key

// Copy back the config to the container and restart
docker cp grafana.ini grafana:/etc/grafana/grafana.ini
docker container restart grafana
Now you can open in your browser to grafana “https://0.0.0.0:3000/ ” using admin/admin
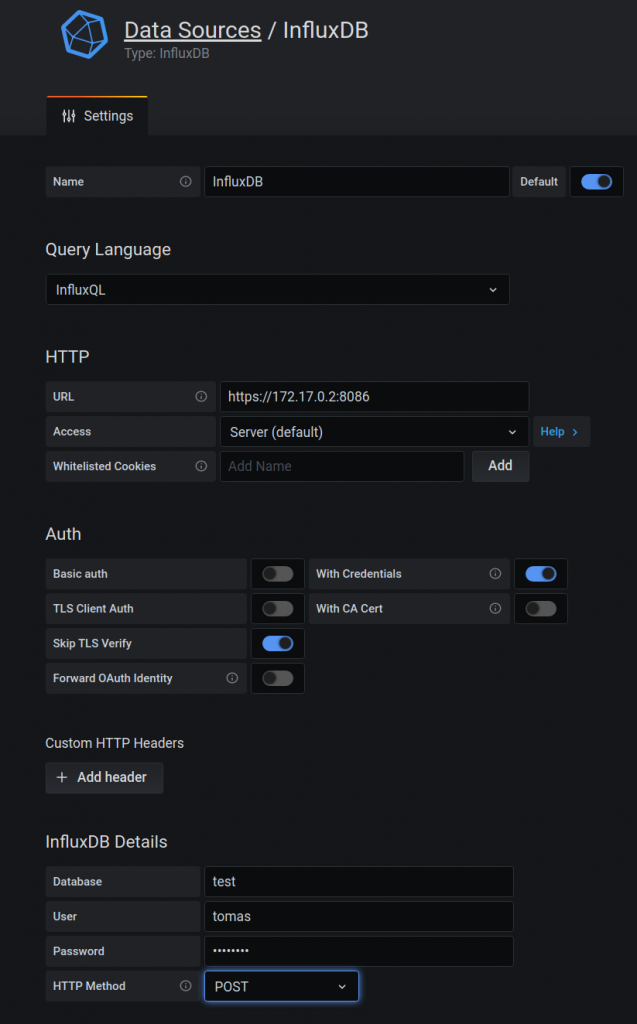
You need to add a data source that is our influxdb container. So you need to pick up the “influxdb” type and fill the values as per below.
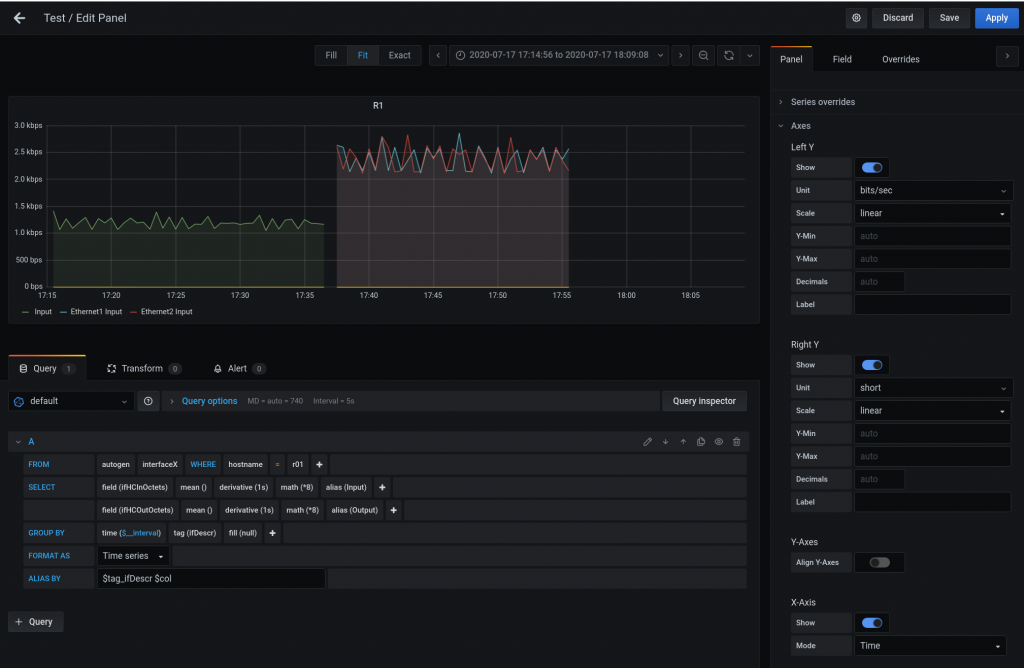
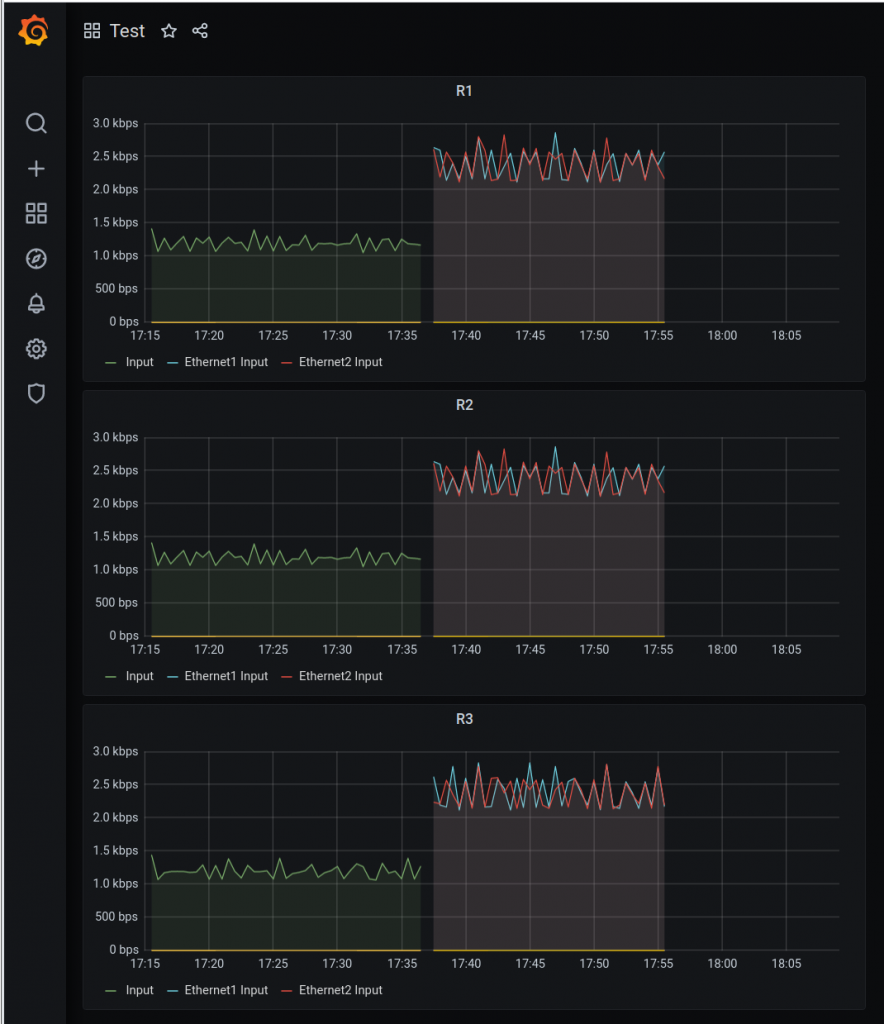
Now, you need to create a dashboard with panel.
Links that I reviewed for creating the dasbord
For creating a panel. The link below was the best on section “Interface Throughput”. Big thanks to the author.
BTW, you need to config SNMP in the switches so telegraf can poll it:
snmp-server location ceoslab
snmp-server community xxx123 ro
snmp-server host 172.17.0.1 version 2c xxx123
In my case, the stack of containers Influx-Telegraf-Grafana are running on the default bridge. Each container has its own IP but as the Arista containers are in the different docker network, it needs to “route” so the IP of telegraf container will be NAT-ed to 172.17.0.1 from the switches point of view.
Next
I would like to manage all this process via Ansible… Something like this.. but will take me time
In the past, I have had to use Centos systems a lot at work and there was something I really liked from rpm, it is “yum provides” that tells you which package you need to install based on the command you need.
I always struggle to do that in Debian. I hope I remember it for the next time. Based on this link:
# aptitude install apt-file

# apt-file update

# apt-file search snmpwalk
libnet-snmp-perl: /usr/share/doc/libnet-snmp-perl/examples/snmpwalk.pl
libsnmp-session-perl: /usr/share/doc/libsnmp-session-perl/examples/snmpwalkh.pl
python3-pysnmp4-apps: /usr/bin/pysnmpwalk
python3-pysnmp4-apps: /usr/share/man/man1/pysnmpwalk.1.gz
snmp: /usr/bin/snmpwalk  <=== THIS IS WHAT I WANT !!!!
snmp: /usr/share/man/man1/snmpwalk.1.gz
snmpsim: /usr/share/doc/snmpsim/examples/data/foreignformats/linux.snmpwalk.gz
snmpsim: /usr/share/doc/snmpsim/examples/data/foreignformats/winxp1.snmpwalk.gz

# aptitude install snmp
Key presses for more visual people:
1- Enter Command Mode:
Escape

2- Move around to the start of the area to indent:
hjkl↑↓←→

3- Start a block:
v

4- Move around to the end of the area to indent:
hjkl↑↓←→

5- Type the number of indentation levels you want
0..9

6- Execute the indentation on the block:
>
I had already a key that I wanted to use. So adding it to the repo was ok.
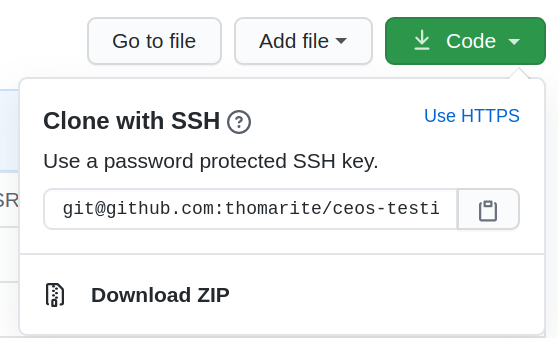
Testing it was my challenge. I was missing two things. My key wasn’t following the standard file name so it wasn’t used by my ssh-agent and then, i wasn’t using the “git” user when testing…. I was using my github username.
$ ssh-keygen -t ed25519 -C "your@email.com"
Generating public/private ed25519 key pair.
Enter file in which to save the key (/home/USERNAME/.ssh/id_ed25519): /home/USERNAME/.ssh/id_ed25519.github
1- You need to increase the logging of your sshd (destination – server)
server# vim /etc/ssh/sshd_config
LogLevel VERBOSE
server# service sshd restart
server# tail -f /var/log/auth.log
2- From client, just ssh as usual to the server and check auth.log as per above
Jul 3 14:17:55 server sshd[8600]: Connection from IPV6 port 57628 on IPV6::453 port 64022
Jul 3 14:17:55 server sshd[8600]: Postponed publickey for client from IPv6 port 57628 ssh2 [preauth]
Jul 3 14:17:55 server sshd[8600]: Accepted publickey for client from IPv6 port 57628 ssh2: ED25519 SHA256:BtOAX9eVpFJJgJ5HzjKU8E973m+MX+3gDxsm7eT/iEQ
Jul 3 14:17:55 server sshd[8600]: pam_unix(sshd:session): session opened for user client by (uid=0)
Jul 3 14:17:55 server sshd[8600]: User child is on pid 8606
Jul 3 14:17:55 server sshd[8606]: Starting session: shell on pts/7 for client from IPv6 port 57628 id 0
3- So we have the fingertip of the key used by client. Now we need to get the fingertips of our clients keys to find the match: