Continuation of the first part, this time we want to establish dynamic LSP, so we will use LDP for label exchange and ISIS as IGP.
Again, I am following the author post but adapting it to my environment. The latest stable FRR is 7.5. All my data is here.
So once the routers R1, R2 and R3 are configured and FRR is reload (very important, restart doesnt do the trick). ISIS and LDP will come up, you need just need to be a bit patience.
Checking on R2, we can see ISIS and LDP established to R1 and R3 respectively. So this is a very good sign.
R2# show isis neighbor
 Area ISIS:
   System Id           Interface   L  State        Holdtime SNPA
   R1                  ens6        2  Up            30       2020.2020.2020
   R3                  ens7        2  Up            28       2020.2020.2020
 R2#
 R2# show mpls ldp neighbor
 AF   ID              State       Remote Address    Uptime
 ipv4 172.20.15.1     OPERATIONAL 172.20.15.1     00:27:44
 ipv4 172.20.15.3     OPERATIONAL 172.20.15.3     00:27:47
 R2#
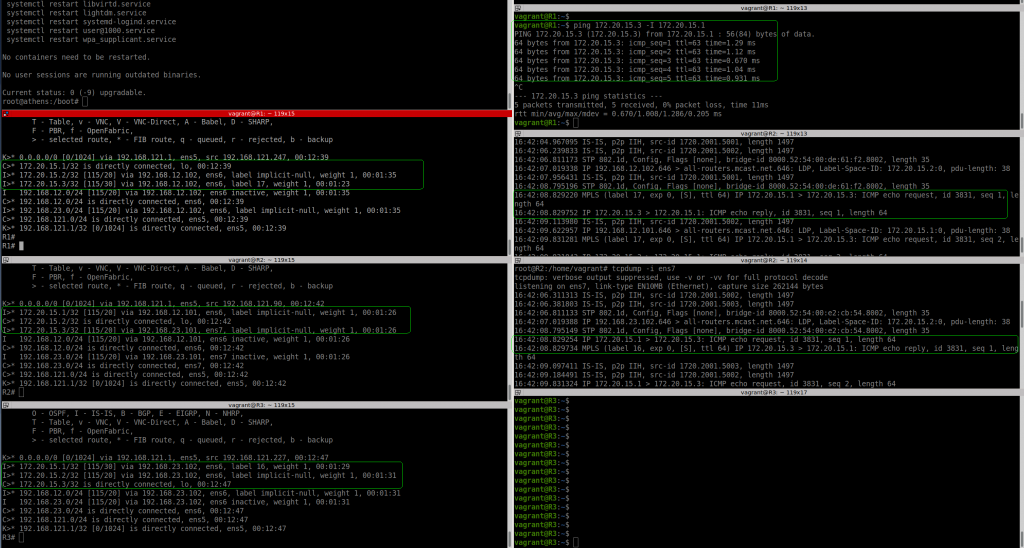
Let’s check the routing table is programmed as expected. R2 is learning R1 and R3 loopbacks via ISIS and it reachable via MPLS (using implicit-null because R2 is doing Penultimate Hop Popping – PHP) based on the LDP bindings.
R2# show ip route
 Codes: K - kernel route, C - connected, S - static, R - RIP,
        O - OSPF, I - IS-IS, B - BGP, E - EIGRP, N - NHRP,
        T - Table, v - VNC, V - VNC-Direct, A - Babel, D - SHARP,
        F - PBR, f - OpenFabric,
        > - selected route, * - FIB route, q - queued, r - rejected, b - backup
 K>* 0.0.0.0/0 [0/1024] via 192.168.121.1, ens5, src 192.168.121.90, 00:12:42
 I>* 172.20.15.1/32 [115/20] via 192.168.12.101, ens6, label implicit-null, weight 1, 00:01:26
 C>* 172.20.15.2/32 is directly connected, lo, 00:12:42
 I>* 172.20.15.3/32 [115/20] via 192.168.23.101, ens7, label implicit-null, weight 1, 00:01:26
 I   192.168.12.0/24 [115/20] via 192.168.12.101, ens6 inactive, weight 1, 00:01:26
 C>* 192.168.12.0/24 is directly connected, ens6, 00:12:42
 I   192.168.23.0/24 [115/20] via 192.168.23.101, ens7 inactive, weight 1, 00:01:26
 C>* 192.168.23.0/24 is directly connected, ens7, 00:12:42
 C>* 192.168.121.0/24 is directly connected, ens5, 00:12:42
 K>* 192.168.121.1/32 [0/1024] is directly connected, ens5, 00:12:42
 R2#
R2# show mpls ldp binding
 AF   Destination          Nexthop         Local Label Remote Label  In Use
 ipv4 172.20.15.1/32       172.20.15.1     16          imp-null         yes
 ipv4 172.20.15.1/32       172.20.15.3     16          18                no
 ipv4 172.20.15.2/32       172.20.15.1     imp-null    16                no
 ipv4 172.20.15.2/32       172.20.15.3     imp-null    16                no
 ipv4 172.20.15.3/32       172.20.15.1     17          18                no
 ipv4 172.20.15.3/32       172.20.15.3     17          imp-null         yes
 ipv4 192.168.12.0/24      172.20.15.1     imp-null    imp-null          no
 ipv4 192.168.12.0/24      172.20.15.3     imp-null    17                no
 ipv4 192.168.23.0/24      172.20.15.1     imp-null    17                no
 ipv4 192.168.23.0/24      172.20.15.3     imp-null    imp-null          no
 ipv4 192.168.121.0/24     172.20.15.1     imp-null    imp-null          no
 ipv4 192.168.121.0/24     172.20.15.3     imp-null    imp-null          no
 R2#
Now, let’s do the ping test and see if MPLS is actually used.
I can see clearly on the left hand side, that R2-ens6 (link to R1) is receiving the ICMP request as MPLS packet (label 17) and the ICMP reply is sent back to R1 without label (as expected by PHP). In R2-ens7 (link to R3) we see R2 sending the ICMP request without label (again expected due to PHP) and the ICMP reply from R3 is arriving with label 16 to R2.
I have to say that I had to try twice until things got working as expected. In my first attempt, somehow, R1 was not sending ICMP request to R2 encapsulated as MPLS packet, somehow the routing table was still programmed for only ISIS. Although ISIS, LDP and LDP bindings were correc.t
NOTES:
1- vagrant-nfs: I was thinking how to connect the VMs with my laptop for sharing files easily. It seems that by default the folder which is holding your Vagrant file is automatically exported in NFS in /vagrant in the VMs. Super handy. Just in case, a bit of documentation. My vagrant version is 2.2.14.
2- For loading the FRR config, I had to “lowercase” the VM hostname to match the FRR config file. Based on this link, it is quite easy. “${X,,}”
In November 2020, I got an email from the FRR email list about using MPLS with FRR. And the answer that you could do already natively (and easily) MPLS in Linux dumbfound me. So I add in my to-do list, try MPLS in Linux as per the blog. So all credits to the author, that’s a great job.
So reading the blog, I learned that the kernel supported MPLS since 4.3 (I am using 5.10) and creating VRF support was challenging until Cumulus did it. Thanks! So since April 2017 there is full support for L3VPNs in Linux… I’m getting a bit late in the wagon.
Anyway, I want to test myself and see if I can make it work. I downloaded the repo from the author to start working on it.
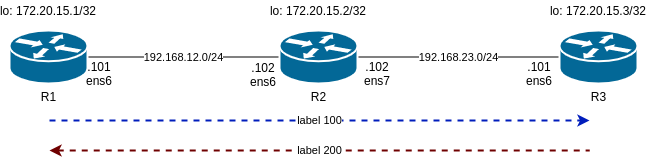
So I am following the same steps as him and will start with a lab consisting of static LSP. This is the diagram:
Main differences in my lab are:
1- I use libvirt instead of VirtualBox
2- I am using debian10 buster64 as VM
This affect the Vagrant file and the script to configure the static LSP. The libvirt_ commands I am using in Vagrantfile are ignored as I am not able to name the interfaces as I want. As well, I had to change the IP addressing as I had collisions with .1. And debian/buster64 has specific interfaces names that I have to use.
So, now we can turn up the lab.
/mpls-linux/lab1-static-lsps$ vagrant up
 Bringing machine 'r1' up with 'libvirt' provider…
 Bringing machine 'r2' up with 'libvirt' provider…
 Bringing machine 'r3' up with 'libvirt' provider…
 ==> r2: Checking if box 'debian/buster64' version '10.4.0' is up to date…
 ==> r3: Checking if box 'debian/buster64' version '10.4.0' is up to date…
 ==> r1: Checking if box 'debian/buster64' version '10.4.0' is up to date…
 ==> r1: Creating image (snapshot of base box volume).
 ==> r2: Creating image (snapshot of base box volume).
 ==> r3: Creating image (snapshot of base box volume).
 ==> r2: Creating domain with the following settings…
 ==> r1: Creating domain with the following settings…
...
/mpls-linux/lab1-static-lsps master$ vagrant status
 Current machine states:
 r1                        running (libvirt)
 r2                        running (libvirt)
 r3                        running (libvirt)
So we can check R1. One important detail here, is how we can defined a static route to reach R3 loopback and it is encapsulated in MPLS with label 100.
/mpls-linux/lab1-static-lsps$ vagrant ssh r1
...
vagrant@R1:~$ lsmod | grep mpls
 mpls_iptunnel          16384  1
 mpls_router            36864  1 mpls_iptunnel
 ip_tunnel              24576  1 mpls_router
 vagrant@R1:~$
 vagrant@R1:~$ ip route
 default via 192.168.121.1 dev ens5 proto dhcp src 192.168.121.124 metric 1024
 172.20.15.3  encap mpls  100 via 192.168.12.102 dev ens6
 192.168.12.0/24 dev ens6 proto kernel scope link src 192.168.12.101
 192.168.121.0/24 dev ens5 proto kernel scope link src 192.168.121.124
 192.168.121.1 dev ens5 proto dhcp scope link src 192.168.121.124 metric 1024
 vagrant@R1:~$
 vagrant@R1:~$ ip -4 a
 1: lo:  mtu 65536 qdisc noqueue state UNKNOWN group default qlen 1000
     inet 127.0.0.1/8 scope host lo
        valid_lft forever preferred_lft forever
     inet 172.20.15.1/32 scope global lo
        valid_lft forever preferred_lft forever
 2: ens5:  mtu 1500 qdisc pfifo_fast state UP group default qlen 1000
     inet 192.168.121.124/24 brd 192.168.121.255 scope global dynamic ens5
        valid_lft 3204sec preferred_lft 3204sec
 3: ens6:  mtu 1500 qdisc pfifo_fast state UP group default qlen 1000
     inet 192.168.12.101/24 brd 192.168.12.255 scope global ens6
        valid_lft forever preferred_lft forever
 vagrant@R1:~$
Now check R2 as it is our P router between R1 and R3 as per diagram. Important bit here is “ip -M route show”. This shows the MPLS routing label that is based in labels. In the standard “ip route” you dont seen any reference to MPLS.
vagrant@R2:~$ ip -4 a
 1: lo:  mtu 65536 qdisc noqueue state UNKNOWN group default qlen 1000
     inet 127.0.0.1/8 scope host lo
        valid_lft forever preferred_lft forever
     inet 172.20.15.2/32 scope global lo
        valid_lft forever preferred_lft forever
 2: ens5:  mtu 1500 qdisc pfifo_fast state UP group default qlen 1000
     inet 192.168.121.103/24 brd 192.168.121.255 scope global dynamic ens5
        valid_lft 2413sec preferred_lft 2413sec
 3: ens6:  mtu 1500 qdisc pfifo_fast state UP group default qlen 1000
     inet 192.168.12.102/24 brd 192.168.12.255 scope global ens6
        valid_lft forever preferred_lft forever
 4: ens7:  mtu 1500 qdisc pfifo_fast state UP group default qlen 1000
     inet 192.168.23.102/24 brd 192.168.23.255 scope global ens7
        valid_lft forever preferred_lft forever
 vagrant@R2:~$ ip route
 default via 192.168.121.1 dev ens5 proto dhcp src 192.168.121.103 metric 1024
 192.168.12.0/24 dev ens6 proto kernel scope link src 192.168.12.102
 192.168.23.0/24 dev ens7 proto kernel scope link src 192.168.23.102
 192.168.121.0/24 dev ens5 proto kernel scope link src 192.168.121.103
 192.168.121.1 dev ens5 proto dhcp scope link src 192.168.121.103 metric 1024
 vagrant@R2:~$
 vagrant@R2:~$ lsmod | grep mpls
 mpls_router            36864  0
 ip_tunnel              24576  1 mpls_router
 vagrant@R2:~$
 vagrant@R2:~$ ip -M route show
 100 via inet 192.168.23.101 dev ens7
 200 via inet 192.168.12.101 dev ens6
 vagrant@R2:~$
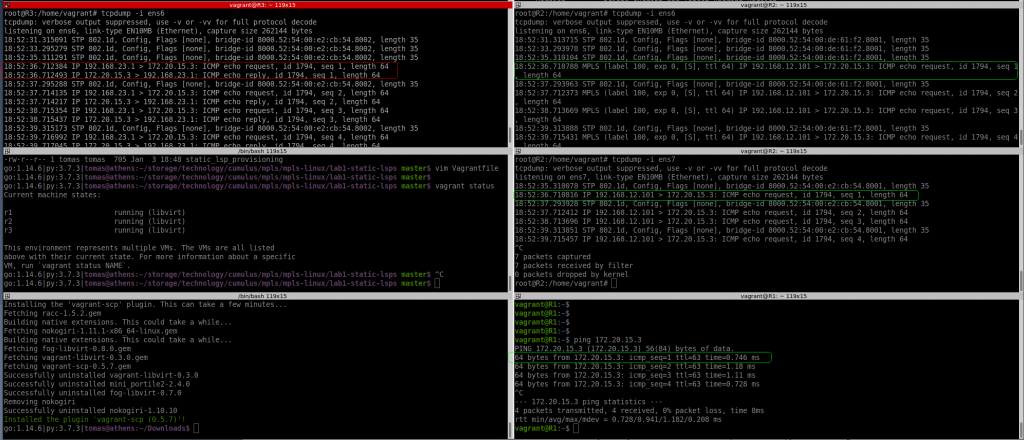
So let’s see if pinging the loopback in R1 and R3 gets labelled traffic:
I can see the labelled packet from R1 to R2 with label 100 as expected, but I dont see any “echo reply”…..
But ping is successful based on R1:
vagrant@R1:~$ ping 172.20.15.3
 PING 172.20.15.3 (172.20.15.3) 56(84) bytes of data.
 64 bytes from 172.20.15.3: icmp_seq=1 ttl=63 time=0.746 ms
 64 bytes from 172.20.15.3: icmp_seq=2 ttl=63 time=1.18 ms
 64 bytes from 172.20.15.3: icmp_seq=3 ttl=63 time=1.11 ms
 64 bytes from 172.20.15.3: icmp_seq=4 ttl=63 time=0.728 ms
Something is wrong. As per pic below, with tcpdump in all interfaces, R3 is seeing the echo request from a different source (not R1).
And if I ping using R1 loopback, I can’t see anything leaving R1 ens6 interface.
vagrant@R1:~$ ping 172.20.15.3 -I lo
 PING 172.20.15.3 (172.20.15.3) from 172.20.15.1 lo: 56(84) bytes of data.
 ^C
 --- 172.20.15.3 ping statistics ---
 25 packets transmitted, 0 received, 100% packet loss, time 576ms
Based on the original blog post, this should work. The main difference here is I am using libvirt. Need to carry on investigating
This is my IP config, 23.1 is my laptop:
9: virbr3:  mtu 1500 qdisc noqueue state UP group default qlen 1000
     inet 192.168.121.1/24 brd 192.168.121.255 scope global virbr3
        valid_lft forever preferred_lft forever
 10: virbr8:  mtu 1500 qdisc noqueue state UP group default qlen 1000
     inet 192.168.12.1/24 brd 192.168.12.255 scope global virbr8
        valid_lft forever preferred_lft forever
 11: virbr9:  mtu 1500 qdisc noqueue state UP group default qlen 1000
     inet 192.168.23.1/24 brd 192.168.23.255 scope global virbr9
        valid_lft forever preferred_lft forever
How to ssh to a vagrant box without using “vagran ssh”: link
# save the config to a file
vagrant ssh-config > vagrant-ssh

# run ssh with the file
ssh -F vagrant-ssh default

# update your .gitignore for not tracking this file!!!!
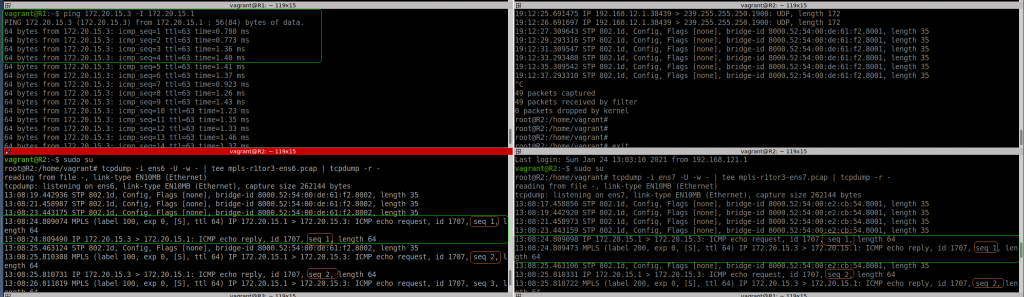
Ok, I have tried again. I rebooted my laptop, rebuilt the VMs, etc. And now it works
9: virbr3:  mtu 1500 qdisc noqueue state UP group default qlen 1000
     inet 192.168.121.1/24 brd 192.168.121.255 scope global virbr3
        valid_lft forever preferred_lft forever
 10: virbr8:  mtu 1500 qdisc noqueue state UP group default qlen 1000
     inet 192.168.12.1/24 brd 192.168.12.255 scope global virbr8
        valid_lft forever preferred_lft forever
 11: virbr9:  mtu 1500 qdisc noqueue state UP group default qlen 1000
     inet 192.168.23.1/24 brd 192.168.23.255 scope global virbr9
        valid_lft forever preferred_lft forever
 root@athens:/boot# uname -a
 Linux athens 5.9.0-5-amd64 #1 SMP Debian 5.9.15-1 (2020-12-17) x86_64 GNU/Linux
 root@athens:/boot#
I can see now clearly, how the ICMP request packet is encapsulated with MPLS tag 100 from R1 to R2 (ens6 interface), then the label is popped in R2, and you can see the same ICMP request leaving R2 via ens7 to R3.
Then the ICMP reply is encapsulated with MPLS tag 200 in R3 to R2 (ens7) and again, the labels is popped in R2, and you see the packet again from R2 (ens6) to R1.
So this test is successful at the end although not sure what I have been doing wrong before.
I had a couple of blogs from cloudflare regarding DNS infrastructure. One is regarding DNS secondary and the other about having multiple DNS primary servers in a different provider.
Regarding the Secondary DNS is interesting how they have moved to a kubernetes infrastructure with its issues.
For setting up, different primary servers in a different provider makes sense nowadays with so many options. But there is some research to be done. You dont want the new primary DNS servers relaying in the same cloud provider as your current setup. It is interesting the mention using OctoDNS for zone management and TeamCity for CI/CD.
I have reading this book (1st edit – quite old) in the last months after breakfast. So I am taking some notes. I think they are things useful and I should use them. So try to write, understand, remember and use.
I am using bash 5.1.0(1)-rc3
$ bash --version
GNU bash, version 5.1.0(1)-rc3 (x86_64-pc-linux-gnu)
1- Quoting
Shell quoting: Enclose a string in single quotes unless it contains elements that you want the shell to interpolate
$ echo John has $100 note?!
John has 00 note?!
$ echo "John has $100 note?!"
John has 00 note?!
$ echo 'John has $100 note?!'
John has $100 note?!
You can’t embed a single quote inside single quotes even with a backslash. Nothing is interpolated inside single quotes. Workaround is using double quotes with escapes or, escaping a single quote outside of surrounding single quotes.
$ echo 'John doesn't have $100 notes'
^C
$
$ echo "John doesn't have $100 notes"
John doesn't have 00 notes
$
$ echo "John doesn't have \$100 notes"
John doesn't have $100 notes
$
$ echo 'John doesn'\''t have $100 notes'
John doesn't have $100 notes
$
2- Standard Output/Input
Redirect output from “ls”: It can be confusing when redirecting output from “ls” to a file and then read it as you dont see the expected format. Using “-C” you ensure the redirection will be based on “Colummns”. By default (-1), the output will be based on lines.
$ ls -ltr
total 92
-rw-r--r-- 1 tomas tomas 72533 Jul 27 2016 jabber.py
-rw-r--r-- 1 tomas tomas 16087 Jul 27 2016 anotify.py
drwxr-xr-x 2 tomas tomas 4096 Dec 10 2017 autoload
$ ls
anotify.py autoload jabber.py
$ ls > /tmp/test.txt
$ cat /tmp/test.txt    --> You would expect just one line like "ls"????
anotify.py
autoload
jabber.py
$
$ ls -C > /tmp/test2.txt
$ cat /tmp/test2.txt   --> Yes, this is the same output of standard "ls"
anotify.py autoload jabber.py
$ ls -C
anotify.py autoload jabber.py
$ ls -1
anotify.py
autoload
jabber.py
$
Redirect output and error to different files:
$ ls -ltr /boot/* > /tmp/test-out.txt 2> /tmp/test-err.txt
$
$ cat /tmp/test-out.txt
...
-rw-r--r-- 1 root root 73210069 Nov 28 11:10 /boot/initrd.img-5.9.0-1-amd64
-rw-r--r-- 1 root root 234724 Nov 28 11:10 /boot/config-5.9.0-1-amd64
/boot/grub:
total 2379
...
-rw-r--r-- 1 root root 2394102 Nov 14 18:12 unicode.pf2
-r--r--r-- 1 root root 8362 Nov 28 10:53 grub.cfg
$
$ cat /tmp/test-err.txt
ls: cannot open directory '/boot/efi': Permission denied
ls: cannot open directory '/boot/lost+found': Permission denied
$
Redirect output and error to same file, use “>&“. Other option is “$ program > outfile 2>&1“
$ ls -ltr /boot/* >& /tmp/test-both.txt
$
$ cat /tmp/test-both.txt
...
-rw-r--r-- 1 root root 73210069 Nov 28 11:10 /boot/initrd.img-5.9.0-1-amd64
-rw-r--r-- 1 root root 234724 Nov 28 11:10 /boot/config-5.9.0-1-amd64
ls: cannot open directory '/boot/efi': Permission denied
ls: cannot open directory '/boot/lost+found': Permission denied
/boot/grub:
total 2379
...
-rw-r--r-- 1 root root 2394102 Nov 14 18:12 unicode.pf2
-r--r--r-- 1 root root 8362 Nov 28 10:53 grub.cfg
$
$ ls -ltr /boot/* > /tmp/test3.txt
ls: cannot open directory '/boot/efi': Permission denied
ls: cannot open directory '/boot/lost+found': Permission denied
$
Grouping output from several commands: Use () for grouping them
:/tmp/aaa/bbb$ (ls -ltr; pwd; cd ..; ls -ltr; pwd) > /tmp/all.txt
:/tmp/aaa/bbb$
:/tmp/aaa/bbb$ cat /tmp/all.txt
total 0
-rw-r--r-- 1 tomas tomas 0 Nov 28 16:28 b.txt
/tmp/aaa/bbb
total 4
drwxr-xr-x 2 tomas tomas 4096 Nov 28 16:28 bbb
-rw-r--r-- 1 tomas tomas 0 Nov 28 16:28 aaa.txt
/tmp/aaa
:/tmp/aaa/bbb$
“tee“: read from standard input and write to standard output and files:
:/tmp/bbb$ ls -ltr
total 32
-rw-r--r-- 1 tomas tomas 30 Nov 28 15:29 test.txt
-rw-r--r-- 1 tomas tomas 32 Nov 28 15:30 test2.txt
-rw-r--r-- 1 tomas tomas 58 Nov 28 15:38 error.txt
-rw-r--r-- 1 tomas tomas 935 Nov 28 15:57 test-out.txt
-rw-r--r-- 1 tomas tomas 121 Nov 28 15:57 test-err.txt
-rw-r--r-- 1 tomas tomas 1056 Nov 28 15:59 test-both.txt
-rw-r--r-- 1 tomas tomas 935 Nov 28 16:00 test3.txt
-rw-r--r-- 1 tomas tomas 1 Nov 28 16:47 all.txt
-rw-r--r-- 1 tomas tomas 0 Nov 28 16:52 a.a
-rw-r--r-- 1 tomas tomas 0 Nov 28 16:52 a.aa
-rw-r--r-- 1 tomas tomas 0 Nov 28 16:52 a.aaa
:/tmp/bbb$
:/tmp/bbb$
:/tmp/bbb$ find . -name '*.txt'
./all.txt
./test.txt
./test3.txt
./test2.txt
./test-out.txt
./error.txt
./test-both.txt
./test-err.txt
:/tmp/bbb$
:/tmp/bbb$ find . -name '.txt' | tee /tmp/tee.txt
./all.txt
./test.txt
./test3.txt
./test2.txt
./test-out.txt
./error.txt
./test-both.txt
./test-err.txt
:/tmp/bbb$
:/tmp/bbb$ cat /tmp/tee.txt
./all.txt
./test.txt
./test3.txt
./test2.txt
./test-out.txt
./error.txt
./test-both.txt
./test-err.txt
:/tmp/bbb$
Here-Doc: use \EOF to turn off shell scripting features inside here-doc.
:/tmp/aaa$ bash here.txt bb
bb $2
:/tmp/aaa$ bash here.txt aa
aa $1
:/tmp/aaa$
:/tmp/aaa$ cat here.txt
here-doc example
grep $1 <<\EOF
name note
aa $1
bb $2
cc $3
EOF
:/tmp/aaa$
“$?”return non-zero if the last command fails.
:/tmp$ pwd
/tmp
:/tmp$ echo $?
0
“&&” run next program if the preceding program worked (logic and)
:/tmp$ ./test && date
bash: ./test: No such file or directory
:/tmp$
:/tmp$ pwd && date
/tmp
Sat 28 Nov 17:20:50 GMT 2020
:/tmp$
“||” (logic or)
:/tmp/aaa$ ./test || ( printf "%b" "Failed.\n")
bash: ./test: No such file or directory
Failed.
:/tmp/aaa$
nohup: run job in background and exit shell before finishing job.
$ nohup ./long-script &
for loop:
:/tmp/aaa$ for FILE in bbb/*
do
if [ -f $FILE ]
then
cat $FILE
fi
done
a file
b file
c file
:/tmp/aaa$ ls -ltr bbb/
total 12
-rw-r--r-- 1 tomas tomas 7 Nov 28 17:30 a.txt
-rw-r--r-- 1 tomas tomas 7 Nov 28 17:30 b.txt
-rw-r--r-- 1 tomas tomas 7 Nov 28 17:31 c.txt
This week I have to update a couple of yaml files and add a line in too many places. This is the chance to work smarter. So I searched how to add a line after a match and I found this link. So let’s use sed:
But the I needed to add some spaces to be aligned properly… So I searched again and found this. Now try again adding the spaces we need using “\ ” for each one.
This week I realised that Juniper JunOS was moving to Linux…. called Evolved. I guess they will still be supporting FreeBSD version but long term will be Linux. I am quite surprised as this was really announced early 2020, always late joining the party. So all big boys are running linux at some level: Cisco has done it sometime ago with nx-os, Brocade/Extrene did it too with SLX (based on Ubuntu) and obviously Arista with EOS (based on Fedora). So the trend of more “open” network OS will be on the raise.
And as well, I finished “Indiana Jones and the Temple of Doom” book. Indiana Jones films are among my favourites… although this was was always considered the “worse” (I erased from my mind the “fourth”) I have really enjoyed the book. It was like watching the movie at slow pace and didnt care that I knew the plot. I will get the other books likely.
From a new Cloudflare post, I learned that NTS is a standard. To be honest, I can’t remember there was work for making NTP secure. In the last years I have seen development in PTP for time sync in financial systems but nothing else. So it is nice to see this happening. We only need to encrypt BGP and we are done in the internet.. oh wait. Dreaming is free.
So I am trying to install and configure NTS in my system following these links: link1link2
I have just installed ntpsec via debian packages system and that’s it, ntpsec is running…
# apt install ntpsec
...
# service ntpsec status
● ntpsec.service - Network Time Service
Loaded: loaded (/lib/systemd/system/ntpsec.service; enabled; vendor preset: enabled)
Active: active (running) since Sun 2020-10-04 20:35:58 BST; 6min ago
Docs: man:ntpd(8)
Main PID: 292116 (ntpd)
Tasks: 1 (limit: 9354)
Memory: 10.2M
CGroup: /system.slice/ntpsec.service
└─292116 /usr/sbin/ntpd -p /run/ntpd.pid -c /etc/ntpsec/ntp.conf -g -N -u ntpsec:ntpsec
Oct 04 20:36:02 athens ntpd[292116]: DNS: dns_check: processing 3.debian.pool.ntp.org, 8, 101
Oct 04 20:36:02 athens ntpd[292116]: DNS: Pool taking: 81.128.218.110
Oct 04 20:36:02 athens ntpd[292116]: DNS: Pool poking hole in restrictions for: 81.128.218.110
Oct 04 20:36:02 athens ntpd[292116]: DNS: Pool taking: 139.162.219.252
Oct 04 20:36:02 athens ntpd[292116]: DNS: Pool poking hole in restrictions for: 139.162.219.252
Oct 04 20:36:02 athens ntpd[292116]: DNS: Pool taking: 62.3.77.2
Oct 04 20:36:02 athens ntpd[292116]: DNS: Pool poking hole in restrictions for: 62.3.77.2
Oct 04 20:36:02 athens ntpd[292116]: DNS: Pool taking: 213.130.44.252
Oct 04 20:36:02 athens ntpd[292116]: DNS: Pool poking hole in restrictions for: 213.130.44.252
Oct 04 20:36:02 athens ntpd[292116]: DNS: dns_take_status: 3.debian.pool.ntp.org=>good, 8
#
Checking the default config, there is nothing configured to use NTS so I made some changes based on the links above:
# vim /etc/ntpsec/ntp.conf
...


# Public NTP servers supporting Network Time Security:
server time.cloudflare.com:1234 nts

# Example 2: NTS-secured NTP (default NTS-KE port (123); using certificate pool of the operating system)
server ntp1.glypnod.com iburst minpoll 3 maxpoll 6 nts

#Via https://www.netnod.se/time-and-frequency/how-to-use-nts
server nts.ntp.se:3443 nts iburst
server nts.sth1.ntp.se:3443 nts iburst
server nts.sth2.ntp.se:3443 nts iburst
After restart, still not seeing NTS in sync 🙁
# service ntpsec restart
...
# ntpq -puw
remote refid st t when poll reach delay offset jitter
time.cloudflare.com .NTS. 16 0 - 64 0 0ns 0ns 119ns
ntp1.glypnod.com .NTS. 16 5 - 32 0 0ns 0ns 119ns
2a01:3f7:2:202::202 .NTS. 16 1 - 64 0 0ns 0ns 119ns
2a01:3f7:2:52::11 .NTS. 16 1 - 64 0 0ns 0ns 119ns
2a01:3f7:2:62::11 .NTS. 16 1 - 64 0 0ns 0ns 119ns
0.debian.pool.ntp.org .POOL. 16 p - 256 0 0ns 0ns 119ns
1.debian.pool.ntp.org .POOL. 16 p - 256 0 0ns 0ns 119ns
2.debian.pool.ntp.org .POOL. 16 p - 256 0 0ns 0ns 119ns
3.debian.pool.ntp.org .POOL. 16 p - 64 0 0ns 0ns 119ns
-229.191.57.185.no-ptr.as201971.net .GPS. 1 u 25 64 177 65.754ms 26.539ms 7.7279ms
+ns3.turbodns.co.uk 85.199.214.99 2 u 23 64 177 12.200ms 2.5267ms 1.5544ms
+time.cloudflare.com 10.21.8.19 3 u 25 64 177 5.0848ms 2.6248ms 2.6293ms
-ntp1.wirehive.net 202.70.69.81 2 u 21 64 177 9.6036ms 2.3986ms 1.9814ms
+ns4.turbodns.co.uk 195.195.221.100 2 u 21 64 177 10.896ms 2.9528ms 1.5288ms
-lond-web-1.speedwelshpool.com 194.58.204.148 2 u 23 64 177 5.6202ms 5.8218ms 3.2582ms
-time.shf.uk.as44574.net 85.199.214.98 2 u 29 64 77 9.0190ms 4.9419ms 2.5810ms
lux.22pf.org .INIT. 16 u - 64 0 0ns 0ns 119ns
ns1.thorcom.net .INIT. 16 u - 64 0 0ns 0ns 119ns
time.cloudflare.com .INIT. 16 u - 64 0 0ns 0ns 119ns
time.rdg.uk.as44574.net .INIT. 16 u - 64 0 0ns 0ns 119ns
-herm4.doylem.co.uk 185.203.69.150 2 u 19 64 177 15.024ms 9.5098ms 3.2011ms
-213.251.53.217 193.62.22.74 2 u 17 64 177 5.7211ms 1.4122ms 2.1895ms
*babbage.betadome.net 85.199.214.99 2 u 20 64 177 4.8614ms 4.1187ms 2.5533ms
#
#
# ntpq -c nts
NTS client sends: 56
NTS client recvs good: 0
NTS client recvs w error: 0
NTS server recvs good: 0
NTS server recvs w error: 0
NTS server sends: 0
NTS make cookies: 0
NTS decode cookies: 0
NTS decode cookies old: 0
NTS decode cookies too old: 0
NTS decode cookies error: 0
NTS KE probes good: 8
NTS KE probes_bad: 0
NTS KE serves good: 0
NTS KE serves_bad: 0
#
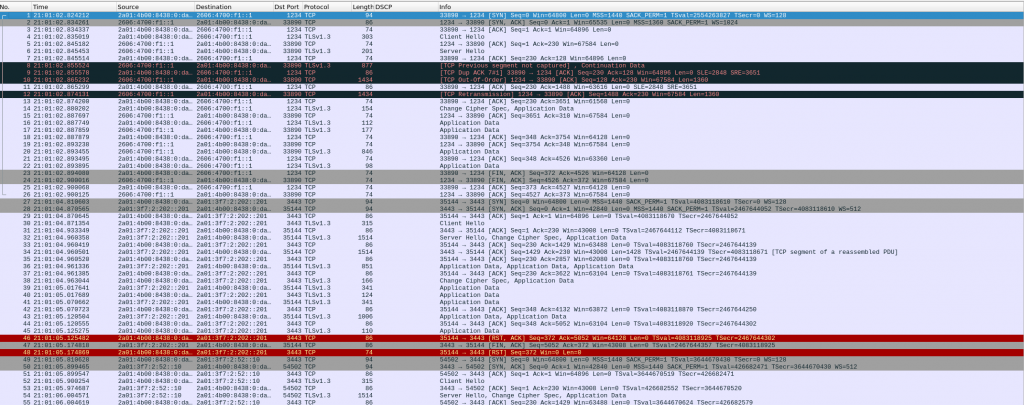
I ran tcpdump filtering on TCP ports 1234 (cloudflare) and 3443 (netnod), and I can see my system trying to negotiate NTS with Cloudflare and NetNod but both sessions are TCP RST 🙁
Last time I tried BPF was via an Ubuntu VM prepared for BPF. But this week checking another article, I realised that I can run BPF natively in my laptop!!!
So aptitude did the job installing the package, and didn’t have to install a new kernel or patch, so super easy and I can see it is working as based in the article:
Another thing I realized lately was that my laptop screen was very dark, not bright at all like my external screen so it was hard to use both. I use Debian Testing LXDE as it is quite light and I dont need anything as heavy as Gnome/KDE. So I struggle how to adjust the brightness but finally got it.
I had to try different programs but finally a blog showed all possibilities and found the one that works for me.
$ brightnessctl set 800 -d intel_backlight
The next thing, I had to be sure that was effective after reboots…. So not sure if this is very clean solution, but I just added that command to my .bashrc. It works. Moving on.
This week I realised that Debian was removing python2 support and surprisingly…. it was trying to remove VirtualBox from my system…
So it seems that VirtualBox is still depending on python2. A bit disappointing.
I am not really keen of VirtualBox but I have had to use it lately for my Kubernetes training and testing OpenBSD. I prefer using kvm/quemu. So I know I will have to workout how to do kubernetes/bsd outside VirtualBox….
Something I learned by the way was to check the dependencies of a package in Debian…. I guess it is about time.