This week I read that kubernetes is going to stop support for Docker soon. I was quite surprised. I am not an expert so it seems they have legit reasons. But I haven’t read anything from the other side. I think it is going to be painful so I need to try that in my lab and see how to do that migration. It has to be nice to learn that.
In the other end, I read a blog entry about ASICs from Cloudflare. I think without getting too technical it is a good one. And I learn about the different type of ASICs from Juniper. In the last years, I have only used devices powered by Broadcom ASICs. One day, I would like to try that P4/Barefoot Tofino devices. And related to this, I remember this NANOG presentation about ASICs that is really good (and fun!).
I was already playing with gNMI and protobuf a couple of months ago. But this week I received a summary from the last NANOG80 meeting and there was a presentation about it. Great job from Colin!
So I decided to give it a go as the demo was based on docker and I have already my Arista lab in cEOS and vEOS as targets.
Ok, the container is created and seems running but the gnmi-gateway can’t connect to my cEOS r01….
First thing, I had to check iptables. It is not the first time that when playing with docker and building different environments (vEOS vs gnmi-gateway) with different docker commands, iptables may be not configured properly.
And it was the case again:
# iptables -t filter -S DOCKER-ISOLATION-STAGE-1
Warning: iptables-legacy tables present, use iptables-legacy to see them
-N DOCKER-ISOLATION-STAGE-1
-A DOCKER-ISOLATION-STAGE-1 -i br-43481af25965 ! -o br-43481af25965 -j DOCKER-ISOLATION-STAGE-2
-A DOCKER-ISOLATION-STAGE-1 -j ACCEPT
-A DOCKER-ISOLATION-STAGE-1 -i docker0 ! -o docker0 -j DOCKER-ISOLATION-STAGE-2
-A DOCKER-ISOLATION-STAGE-1 -i br-94c1e813ad6f ! -o br-94c1e813ad6f -j DOCKER-ISOLATION-STAGE-2
-A DOCKER-ISOLATION-STAGE-1 -i br-4bd17cfa19a8 ! -o br-4bd17cfa19a8 -j DOCKER-ISOLATION-STAGE-2
-A DOCKER-ISOLATION-STAGE-1 -i br-13ab2b6a0d1d ! -o br-13ab2b6a0d1d -j DOCKER-ISOLATION-STAGE-2
-A DOCKER-ISOLATION-STAGE-1 -i br-121978ca0282 ! -o br-121978ca0282 -j DOCKER-ISOLATION-STAGE-2
-A DOCKER-ISOLATION-STAGE-1 -i br-00db5844bbb0 ! -o br-00db5844bbb0 -j DOCKER-ISOLATION-STAGE-2
-A DOCKER-ISOLATION-STAGE-1 -j RETURN
So I moved the new docker bridge network for gnmi-gateway after “ACCEPT” and solved.
# iptables -t filter -D DOCKER-ISOLATION-STAGE-1 -j ACCEPT
# iptables -t filter -I DOCKER-ISOLATION-STAGE-1 -j ACCEPT
#
# iptables -t filter -S DOCKER-ISOLATION-STAGE-1
Warning: iptables-legacy tables present, use iptables-legacy to see them
-N DOCKER-ISOLATION-STAGE-1
-A DOCKER-ISOLATION-STAGE-1 -j ACCEPT
-A DOCKER-ISOLATION-STAGE-1 -i br-43481af25965 ! -o br-43481af25965 -j DOCKER-ISOLATION-STAGE-2
-A DOCKER-ISOLATION-STAGE-1 -i docker0 ! -o docker0 -j DOCKER-ISOLATION-STAGE-2
-A DOCKER-ISOLATION-STAGE-1 -i br-94c1e813ad6f ! -o br-94c1e813ad6f -j DOCKER-ISOLATION-STAGE-2
-A DOCKER-ISOLATION-STAGE-1 -i br-4bd17cfa19a8 ! -o br-4bd17cfa19a8 -j DOCKER-ISOLATION-STAGE-2
-A DOCKER-ISOLATION-STAGE-1 -i br-13ab2b6a0d1d ! -o br-13ab2b6a0d1d -j DOCKER-ISOLATION-STAGE-2
-A DOCKER-ISOLATION-STAGE-1 -i br-121978ca0282 ! -o br-121978ca0282 -j DOCKER-ISOLATION-STAGE-2
-A DOCKER-ISOLATION-STAGE-1 -i br-00db5844bbb0 ! -o br-00db5844bbb0 -j DOCKER-ISOLATION-STAGE-2
-A DOCKER-ISOLATION-STAGE-1 -j RETURN
#
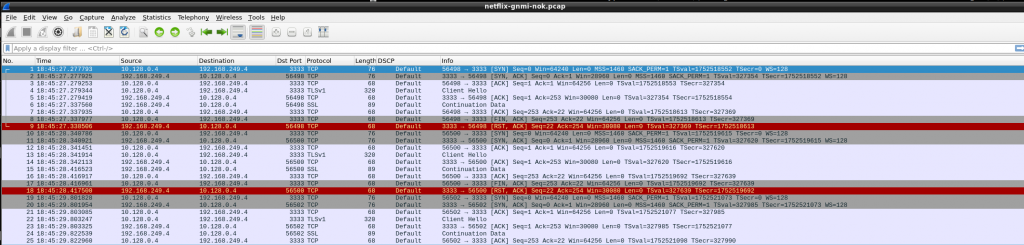
So, restarted gnmi-gateway, still same issue. Ok, I decided to check if the packets were actually hitting r01.
So at first sight, the tcp handshake is established but then there is TCP RST….
So I double checked that gnmi was runnig in my side:
r1#show management api gnmi
Enabled:            Yes
Server:             running on port 3333, in MGMT VRF
SSL Profile:        none
QoS DSCP:           none
r1#
At that moment, I thought that was an issue in cEOS… checking logs I couldnt see any confirmation but I decided to give it a go with vEOS that is more feature rich. So I turned up my GCP lab and followed the same steps with gnmi-gateway. I updated the targets.json with the details of one of my vEOS devices. And run again:
~/gnmi/gnmi-gateway release$ sudo docker run -it --rm -p 59100:59100 -v $(pwd)/examples/gnmi-prometheus/targets.json:/opt/gnmi-gateway/targets.json --name gnmi-gateway-01 --network gnmi-net gnmi-gateway:latest
{"level":"info","time":"2020-11-07T19:22:20Z","message":"Starting GNMI Gateway."}
{"level":"info","time":"2020-11-07T19:22:20Z","message":"Clustering is NOT enabled. No locking or cluster coordination will happen."}
{"level":"info","time":"2020-11-07T19:22:20Z","message":"Starting connection manager."}
{"level":"info","time":"2020-11-07T19:22:20Z","message":"Starting gNMI server on 0.0.0.0:9339."}
{"level":"info","time":"2020-11-07T19:22:20Z","message":"Starting Prometheus exporter."}
{"level":"info","time":"2020-11-07T19:22:20Z","message":"Connection manager received a target control message: 1 inserts 0 removes"}
{"level":"info","time":"2020-11-07T19:22:20Z","message":"Initializing target gcp-r1 ([192.168.249.4:3333]) map[NoTLS:yes]."}
{"level":"info","time":"2020-11-07T19:22:20Z","message":"Target gcp-r1: Connecting"}
{"level":"info","time":"2020-11-07T19:22:20Z","message":"Target gcp-r1: Subscribing"}
{"level":"info","time":"2020-11-07T19:22:20Z","message":"Starting Prometheus HTTP server."}
{"level":"info","time":"2020-11-07T19:22:30Z","message":"Target gcp-r1: Disconnected"}
E1107 19:22:30.048410 1 reconnect.go:114] client.Subscribe (target "gcp-r1") failed: client "gnmi" : client "gnmi" : Dialer(192.168.249.4:3333, 10s): context deadline exceeded; reconnecting in 552.330144ms
{"level":"info","time":"2020-11-07T19:22:40Z","message":"Target gcp-r1: Disconnected"}
E1107 19:22:40.603141 1 reconnect.go:114] client.Subscribe (target "gcp-r1") failed: client "gnmi" : client "gnmi" : Dialer(192.168.249.4:3333, 10s): context deadline exceeded; reconnecting in 1.080381816s
Again, same issue. Let’s see from vEOS perspective.
So again in GCP, tcp is established but then TCP RST. As vEOS is my last resort, I tried to dig into that TCP connection. I downloaded a pcap to analyze with wireshark so get a better visual clue…
So, somehow, gnmi-gateway is trying to negotiate TLS!!! As per my understanding, my targets.json was configured with “NoTLS”: “yes” so that should be avoid, shouldn’t be?
At that moment, I wanted to know how to identfiy TLS/SSL packets using tcpdump as it is not always that easy to get quickly a pcap in wireshark. So I found the answer here:
bash-4.2# tcpdump -i any "tcp port 3333 and (tcp[((tcp[12] & 0xf0) >> 2)] = 0x16)"
tcpdump: verbose output suppressed, use -v or -vv for full protocol decode
listening on any, link-type LINUX_SLL (Linux cooked v1), capture size 262144 bytes
19:47:01.367197 In 1e:3d:5b:13:d8:fe (oui Unknown) ethertype IPv4 (0x0800), length 320: 10.128.0.4.50486 > 192.168.249.4.dec-notes: Flags [P.], seq 2715923852:2715924104, ack 2576249027, win 511, options [nop,nop,TS val 1194424180 ecr 1250876], length 252
19:47:02.405870 In 1e:3d:5b:13:d8:fe (oui Unknown) ethertype IPv4 (0x0800), length 320: 10.128.0.4.50488 > 192.168.249.4.dec-notes: Flags [P.], seq 680803294:680803546, ack 3839769659, win 511, options [nop,nop,TS val 1194425218 ecr 1251136], length 252
19:47:04.139458 In 1e:3d:5b:13:d8:fe (oui Unknown) ethertype IPv4 (0x0800), length 320: 10.128.0.4.50490 > 192.168.249.4.dec-notes: Flags [P.], seq 3963338234:3963338486, ack 1760248652, win 511, options [nop,nop,TS val 1194426952 ecr 1251569], length 252
Not something easy to remember 🙁
Ok, I wanted to be sure that gnmi was functional in vEOS and by a quick internet look up, I found this project gnmic! Great job by the author!
So I configured the tool and tested with my vEOS. And worked (without needing TLS)
So, I kind of I was sure that my issue was configuring gnmi-gateway. I tried to troubleshoot it: removed the NoTLS, using the debugging mode, build the code, read the Go code for Target (too complex for my Goland knowledge 🙁 )
So at the end, I gave up and opened an issue with gnmi-gateway author. And he answered super quick with the solution!!! I misunderstood the meaning of “NoTLS” 🙁
So I followed his instructions to configure TLS in my gnmi cEOS config
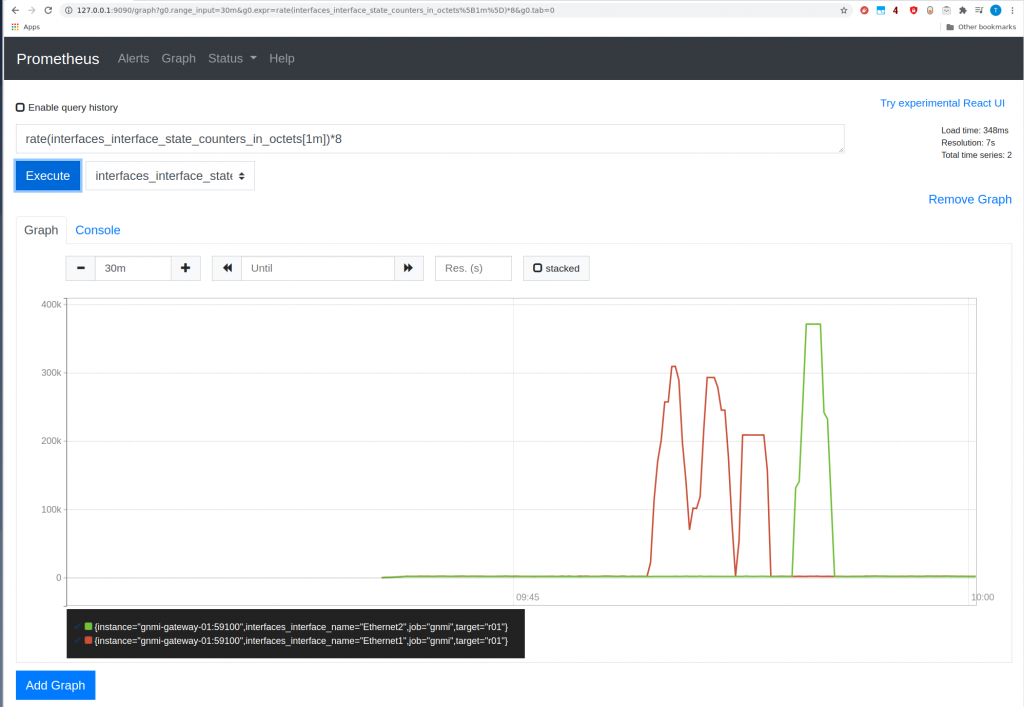
Now we can open prometheus UI and verify if we are consuming data from cEOS r01.
Yeah! it is there.
So all working at then. It has a nice experience. At the end of the day, I want to know more about gNMI/protobuffer, etc. The cold thing here is you can get telemetry and configuration management of your devices. So using gnmi-gateway (that is more for a high availability env like Netflix) and gnmic are great tools to get your head around.
Today finally I have managed to get a very basic cumulus setup. It is annoying because I tried several months ago and found some issues with libvirt (and I opened a ticket but didnt follow up) and gave up.
Now it works. I just want to use KVM-QEMU and Vagrant, that I have already installed in my system. So based on the link, I just created a folder and copied the vagrant file. Then “vagrant up” and wait.
/cumulus/1s2l$ vagrant up
Bringing machine 'spine01' up with 'libvirt' provider…
Bringing machine 'leaf01' up with 'libvirt' provider…
Bringing machine 'leaf02' up with 'libvirt' provider…
==> leaf01: Box 'CumulusCommunity/cumulus-vx' could not be found. Attempting to find and install…
leaf01: Box Provider: libvirt
leaf01: Box Version: 4.2.0
==> leaf01: Loading metadata for box 'CumulusCommunity/cumulus-vx'
leaf01: URL: https://vagrantcloud.com/CumulusCommunity/cumulus-vx
==> leaf01: Adding box 'CumulusCommunity/cumulus-vx' (v4.2.0) for provider: libvirt
leaf01: Downloading: https://vagrantcloud.com/CumulusCommunity/boxes/cumulus-vx/versions/4.2.0/providers/libvirt.box
Download redirected to host: d2cd9e7ca6hntp.cloudfront.net
==> leaf01: Successfully added box 'CumulusCommunity/cumulus-vx' (v4.2.0) for 'libvirt'!
==> spine01: Box 'CumulusCommunity/cumulus-vx' could not be found. Attempting to find and install…
spine01: Box Provider: libvirt
spine01: Box Version: 4.2.0
==> leaf01: Uploading base box image as volume into Libvirt storage…
==> spine01: Loading metadata for box 'CumulusCommunity/cumulus-vx'
spine01: URL: https://vagrantcloud.com/CumulusCommunity/cumulus-vx
Progress: 0%==> spine01: Adding box 'CumulusCommunity/cumulus-vx' (v4.2.0) for provider: libvirt
Progress: 0%==> leaf02: Box 'CumulusCommunity/cumulus-vx' could not be found. Attempting to find and install…
leaf02: Box Provider: libvirt
leaf02: Box Version: 4.2.0
Progress: 1%==> leaf02: Loading metadata for box 'CumulusCommunity/cumulus-vx'
leaf02: URL: https://vagrantcloud.com/CumulusCommunity/cumulus-vx
==> leaf02: Adding box 'CumulusCommunity/cumulus-vx' (v4.2.0) for provider: libvirt
==> leaf01: Creating image (snapshot of base box volume).
==> spine01: Creating image (snapshot of base box volume).
==> leaf02: Creating image (snapshot of base box volume).
==> leaf01: Creating domain with the following settings…
==> leaf01: -- Name: 1s2l_leaf01
==> leaf02: Creating domain with the following settings…
==> spine01: Creating domain with the following settings…
==> leaf02: -- Name: 1s2l_leaf02
==> spine01: -- Name: 1s2l_spine01
==> leaf01: -- Domain type: kvm
==> leaf02: -- Domain type: kvm
==> spine01: -- Domain type: kvm
==> leaf01: -- Cpus: 1
==> leaf02: -- Cpus: 1
==> spine01: -- Cpus: 1
==> leaf01: -- Feature: acpi
==> leaf02: -- Feature: acpi
==> spine01: -- Feature: acpi
==> leaf01: -- Feature: apic
==> leaf01: -- Feature: pae
==> leaf01: -- Memory: 768M
==> leaf02: -- Feature: apic
==> spine01: -- Feature: apic
==> spine01: -- Feature: pae
....
....
You can check the VMs are up:
/cumulus/1s2l$ vagrant status
Current machine states:
spine01 running (libvirt)
leaf01 running (libvirt)
leaf02 running (libvirt)
This environment represents multiple VMs. The VMs are all listed
above with their current state. For more information about a specific
VM, run vagrant status NAME.
/cumulus/1s2l$
And we can login and create some network interfaces as per documentation:
/cumulus/1s2l$ vagrant ssh leaf01
Linux leaf01 4.19.0-cl-1-amd64 #1 SMP Cumulus 4.19.94-1+cl4u5 (2020-07-10) x86_64
Welcome to Cumulus VX (TM)
Cumulus VX (TM) is a community supported virtual appliance designed for
experiencing, testing and prototyping Cumulus Networks' latest technology.
For any questions or technical support, visit our community site at:
http://community.cumulusnetworks.com
The registered trademark Linux (R) is used pursuant to a sublicense from LMI,
the exclusive licensee of Linus Torvalds, owner of the mark on a world-wide
basis.
vagrant@leaf01:mgmt:~$ net add interface swp1,swp2,swp3
vagrant@leaf01:mgmt:~$ net commit
--- /etc/network/interfaces 2020-07-15 01:15:58.000000000 +0000
+++ /run/nclu/ifupdown2/interfaces.tmp 2020-10-31 14:12:30.826000000 +0000
@@ -5,15 +5,24 @@
# The loopback network interface
auto lo
iface lo inet loopback
# The primary network interface
auto eth0
iface eth0 inet dhcp
vrf mgmt
+auto swp1
+iface swp1
+
+auto swp2
+iface swp2
+
+auto swp3
+iface swp3
+
auto mgmt
iface mgmt
address 127.0.0.1/8
address ::1/128
vrf-table auto
net add/del commands since the last "net commit"
User Timestamp Command
------- -------------------------- --------------------------------
vagrant 2020-10-31 14:12:27.070219 net add interface swp1,swp2,swp3
vagrant@leaf01:mgmt:~$
And after configuring the interfaces in the three VMs, we have LLDP working:
/cumulus/1s2l$ vagrant ssh leaf01
Linux leaf01 4.19.0-cl-1-amd64 #1 SMP Cumulus 4.19.94-1+cl4u5 (2020-07-10) x86_64
Welcome to Cumulus VX (TM)
Cumulus VX (TM) is a community supported virtual appliance designed for
experiencing, testing and prototyping Cumulus Networks' latest technology.
For any questions or technical support, visit our community site at:
http://community.cumulusnetworks.com
The registered trademark Linux (R) is used pursuant to a sublicense from LMI,
the exclusive licensee of Linus Torvalds, owner of the mark on a world-wide
basis.
Last login: Sat Oct 31 14:12:04 2020 from 10.255.1.1
vagrant@leaf01:mgmt:~$
vagrant@leaf01:mgmt:~$
vagrant@leaf01:mgmt:~$
vagrant@leaf01:mgmt:~$ net show lldp
LocalPort Speed Mode RemoteHost RemotePort
--------- ----- ------- ---------- ----------
swp1 1G Default spine01 swp1
swp2 1G Default leaf02 swp2
swp3 1G Default leaf02 swp3
vagrant@leaf01:mgmt:~$
vagrant@leaf01:mgmt:~$ net show system
Hostname……… leaf01
Build………… Cumulus Linux 4.2.0
Uptime……….. 0:06:09.180000
Model………… Cumulus VX
Memory……….. 669MB
Vendor Name…… Cumulus Networks
Part Number…… 4.2.0
Base MAC Address. 52:54:00:17:87:07
Serial Number…. 52:54:00:17:87:07
Product Name….. VX
vagrant@leaf01:mgmt:~$ exit
So I am happy because now I have something to play with and try to build an MPLS lab with cumulus. At some point I would like to try some quaga/frr lab.
I am pretty sure that in the past, I didnt have to type my password every single time I run a vagrant command….
Ok, we can shutdown the VMs and start the work for the next time:
/cumulus/1s2l$ vagrant halt spine01 leaf01 leaf02
==> leaf02: Halting domain…
==> leaf01: Halting domain…
==> spine01: Halting domain…
/cumulus/1s2l$
/cumulus/1s2l$
/cumulus/1s2l$ vagrant status
Current machine states:
spine01 shutoff (libvirt)
leaf01 shutoff (libvirt)
leaf02 shutoff (libvirt)
This environment represents multiple VMs. The VMs are all listed
above with their current state. For more information about a specific
VM, run vagrant status NAME.
/cumulus/1s2l$
I was reading through my backlog and noticed too close by incidents. A BGP hijack on 30th September from Telstra and Tokyo Stock Exchange outage on 2nd Oct. At the end of the day, small mistakes/errors (on purpose or not) can cause massive impact (depending on your point of view). For BGP, RPKI is the security framework to make sure the advertised routes belong to the real owners. Yeah, quick summary. But at the end of the day, not all Internet providers are using RPKI, and even if you use it, you can make mistakes. This is better than nothing. For the exchanges, thinking that a piece of hardware can cause a stop to a 6 trillion $ market is crazy. And it seems is just a 350 servers system. That tells me that you dont need the biggest system to hold the biggest value and you will always hit a problem no matter how safe/resilience is your design/implementation/etc. Likely I am making this up and I need to review the book, but one of the conclusions I took from it, via Godel, it doesn’t matter how many statements you use to declare your (software) system, you can always find a weakness (false statement).
This week I realised that Juniper JunOS was moving to Linux…. called Evolved. I guess they will still be supporting FreeBSD version but long term will be Linux. I am quite surprised as this was really announced early 2020, always late joining the party. So all big boys are running linux at some level: Cisco has done it sometime ago with nx-os, Brocade/Extrene did it too with SLX (based on Ubuntu) and obviously Arista with EOS (based on Fedora). So the trend of more “open” network OS will be on the raise.
And as well, I finished “Indiana Jones and the Temple of Doom” book. Indiana Jones films are among my favourites… although this was was always considered the “worse” (I erased from my mind the “fourth”) I have really enjoyed the book. It was like watching the movie at slow pace and didnt care that I knew the plot. I will get the other books likely.
From a new Cloudflare post, I learned that NTS is a standard. To be honest, I can’t remember there was work for making NTP secure. In the last years I have seen development in PTP for time sync in financial systems but nothing else. So it is nice to see this happening. We only need to encrypt BGP and we are done in the internet.. oh wait. Dreaming is free.
So I am trying to install and configure NTS in my system following these links: link1link2
I have just installed ntpsec via debian packages system and that’s it, ntpsec is running…
# apt install ntpsec
...
# service ntpsec status
● ntpsec.service - Network Time Service
Loaded: loaded (/lib/systemd/system/ntpsec.service; enabled; vendor preset: enabled)
Active: active (running) since Sun 2020-10-04 20:35:58 BST; 6min ago
Docs: man:ntpd(8)
Main PID: 292116 (ntpd)
Tasks: 1 (limit: 9354)
Memory: 10.2M
CGroup: /system.slice/ntpsec.service
└─292116 /usr/sbin/ntpd -p /run/ntpd.pid -c /etc/ntpsec/ntp.conf -g -N -u ntpsec:ntpsec
Oct 04 20:36:02 athens ntpd[292116]: DNS: dns_check: processing 3.debian.pool.ntp.org, 8, 101
Oct 04 20:36:02 athens ntpd[292116]: DNS: Pool taking: 81.128.218.110
Oct 04 20:36:02 athens ntpd[292116]: DNS: Pool poking hole in restrictions for: 81.128.218.110
Oct 04 20:36:02 athens ntpd[292116]: DNS: Pool taking: 139.162.219.252
Oct 04 20:36:02 athens ntpd[292116]: DNS: Pool poking hole in restrictions for: 139.162.219.252
Oct 04 20:36:02 athens ntpd[292116]: DNS: Pool taking: 62.3.77.2
Oct 04 20:36:02 athens ntpd[292116]: DNS: Pool poking hole in restrictions for: 62.3.77.2
Oct 04 20:36:02 athens ntpd[292116]: DNS: Pool taking: 213.130.44.252
Oct 04 20:36:02 athens ntpd[292116]: DNS: Pool poking hole in restrictions for: 213.130.44.252
Oct 04 20:36:02 athens ntpd[292116]: DNS: dns_take_status: 3.debian.pool.ntp.org=>good, 8
#
Checking the default config, there is nothing configured to use NTS so I made some changes based on the links above:
# vim /etc/ntpsec/ntp.conf
...


# Public NTP servers supporting Network Time Security:
server time.cloudflare.com:1234 nts

# Example 2: NTS-secured NTP (default NTS-KE port (123); using certificate pool of the operating system)
server ntp1.glypnod.com iburst minpoll 3 maxpoll 6 nts

#Via https://www.netnod.se/time-and-frequency/how-to-use-nts
server nts.ntp.se:3443 nts iburst
server nts.sth1.ntp.se:3443 nts iburst
server nts.sth2.ntp.se:3443 nts iburst
After restart, still not seeing NTS in sync 🙁
# service ntpsec restart
...
# ntpq -puw
remote refid st t when poll reach delay offset jitter
time.cloudflare.com .NTS. 16 0 - 64 0 0ns 0ns 119ns
ntp1.glypnod.com .NTS. 16 5 - 32 0 0ns 0ns 119ns
2a01:3f7:2:202::202 .NTS. 16 1 - 64 0 0ns 0ns 119ns
2a01:3f7:2:52::11 .NTS. 16 1 - 64 0 0ns 0ns 119ns
2a01:3f7:2:62::11 .NTS. 16 1 - 64 0 0ns 0ns 119ns
0.debian.pool.ntp.org .POOL. 16 p - 256 0 0ns 0ns 119ns
1.debian.pool.ntp.org .POOL. 16 p - 256 0 0ns 0ns 119ns
2.debian.pool.ntp.org .POOL. 16 p - 256 0 0ns 0ns 119ns
3.debian.pool.ntp.org .POOL. 16 p - 64 0 0ns 0ns 119ns
-229.191.57.185.no-ptr.as201971.net .GPS. 1 u 25 64 177 65.754ms 26.539ms 7.7279ms
+ns3.turbodns.co.uk 85.199.214.99 2 u 23 64 177 12.200ms 2.5267ms 1.5544ms
+time.cloudflare.com 10.21.8.19 3 u 25 64 177 5.0848ms 2.6248ms 2.6293ms
-ntp1.wirehive.net 202.70.69.81 2 u 21 64 177 9.6036ms 2.3986ms 1.9814ms
+ns4.turbodns.co.uk 195.195.221.100 2 u 21 64 177 10.896ms 2.9528ms 1.5288ms
-lond-web-1.speedwelshpool.com 194.58.204.148 2 u 23 64 177 5.6202ms 5.8218ms 3.2582ms
-time.shf.uk.as44574.net 85.199.214.98 2 u 29 64 77 9.0190ms 4.9419ms 2.5810ms
lux.22pf.org .INIT. 16 u - 64 0 0ns 0ns 119ns
ns1.thorcom.net .INIT. 16 u - 64 0 0ns 0ns 119ns
time.cloudflare.com .INIT. 16 u - 64 0 0ns 0ns 119ns
time.rdg.uk.as44574.net .INIT. 16 u - 64 0 0ns 0ns 119ns
-herm4.doylem.co.uk 185.203.69.150 2 u 19 64 177 15.024ms 9.5098ms 3.2011ms
-213.251.53.217 193.62.22.74 2 u 17 64 177 5.7211ms 1.4122ms 2.1895ms
*babbage.betadome.net 85.199.214.99 2 u 20 64 177 4.8614ms 4.1187ms 2.5533ms
#
#
# ntpq -c nts
NTS client sends: 56
NTS client recvs good: 0
NTS client recvs w error: 0
NTS server recvs good: 0
NTS server recvs w error: 0
NTS server sends: 0
NTS make cookies: 0
NTS decode cookies: 0
NTS decode cookies old: 0
NTS decode cookies too old: 0
NTS decode cookies error: 0
NTS KE probes good: 8
NTS KE probes_bad: 0
NTS KE serves good: 0
NTS KE serves_bad: 0
#
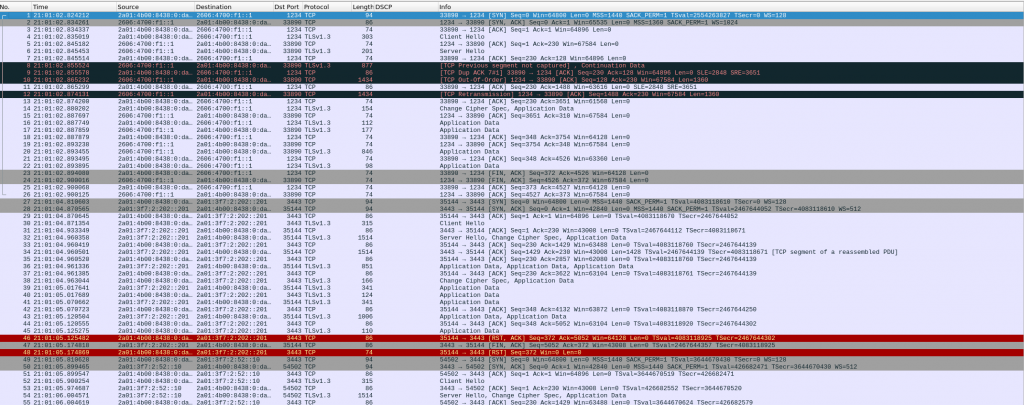
I ran tcpdump filtering on TCP ports 1234 (cloudflare) and 3443 (netnod), and I can see my system trying to negotiate NTS with Cloudflare and NetNod but both sessions are TCP RST 🙁
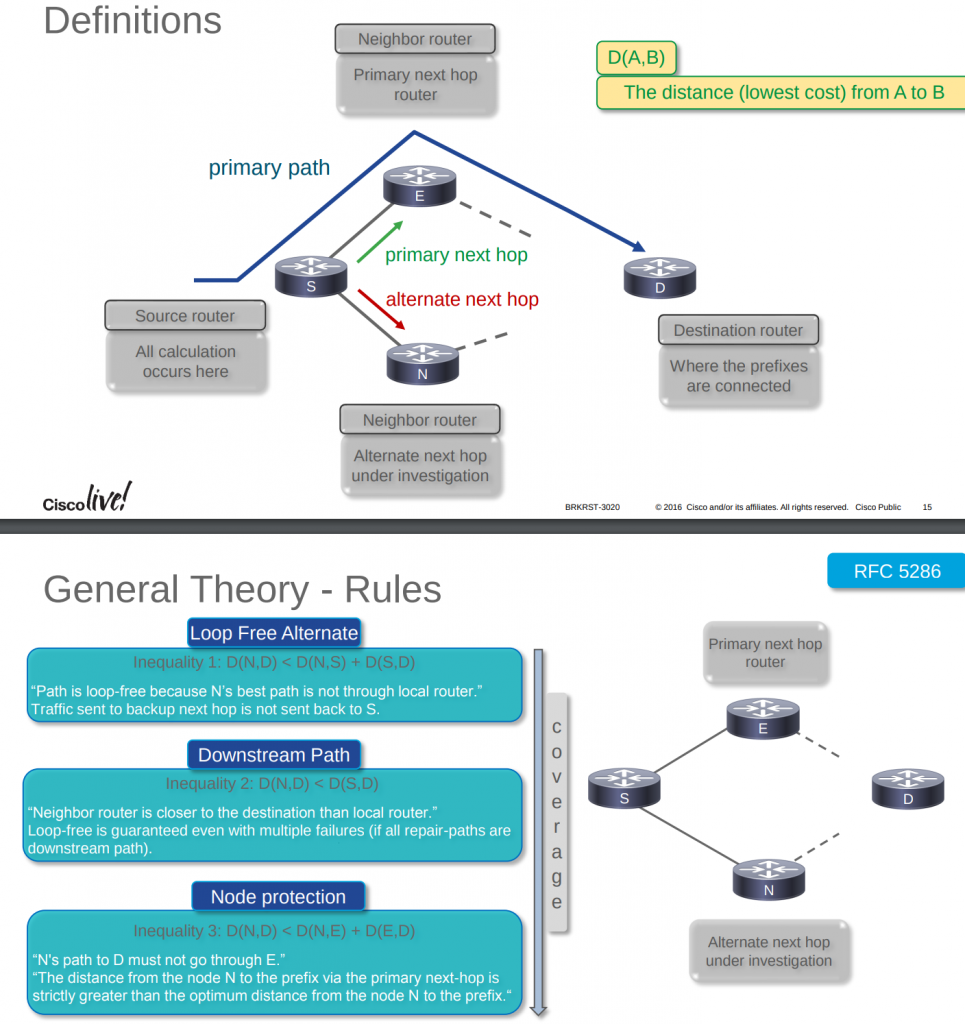
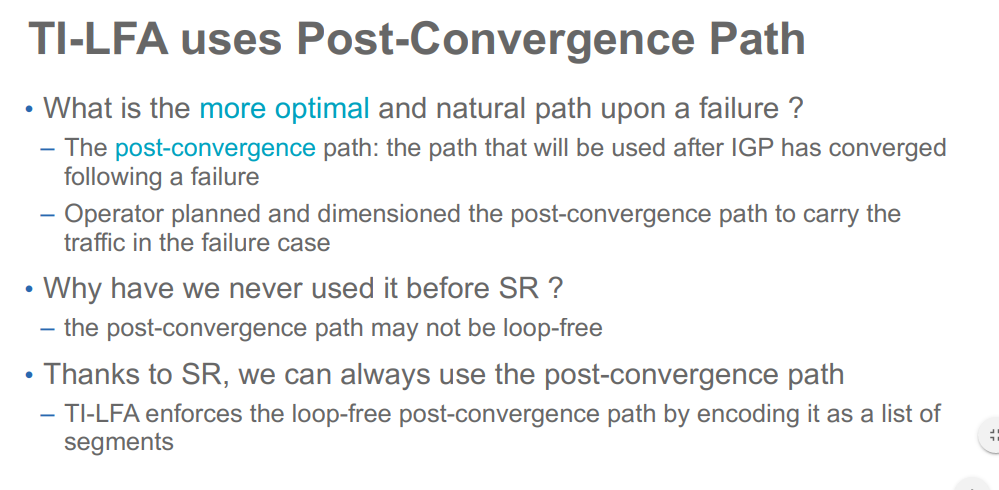
Segment Routing (SR) and Topology Independent Loop Free Alternates (TI-LFA)
Intro
As part of having a MPLS SR lab, I wanted to test FRR (Fast Rerouting) solutions. Arista provides support for FRR TI-LFA based on this link. Unfortunately, if you are not a customer you can’t see that 🙁
But there are other links where you can read about TI-LFA. The two from juniper confuses me when calculating P/Q groups in pre-converge time…
Juniper docs mention always “pre-convergence” but Cisco uses “post-convergence”. I think “post” it is more clear.
EOS TI-LFA Limitations
Backup paths are not computed for prefix segments that do not have a host mask (/32 for v4 and /128 for v6).
When TI-LFA is configured, the number of anycast segments generated by a node cannot exceed 10.
Computing TI-LFA backup paths for proxy node segments is not supported.
Backup paths are not computed for node segments corresponding to multi-homed prefixes. The multi-homing could be the result of them being anycast node segments, loopback interfaces on different routers advertising SIDs for the same prefix, node segments leaked between levels and thus being seen as originated from multiple L1-L2 routers.
Backup paths are only computed for segments that are non-ECMP.
Only IS-IS interfaces that are using the point-to-point network type are eligible for protection.
The backup paths are only computed with respect to link/node failure constraints. SRLG constraint is not yet supported.
Link/node protection only supported in the default VRF owing to the lack of non-default VRF support for IS-IS segment-routing.
Backup paths are computed in the same IS-IS level topology as the primary path.
Even with IS-IS GR configured, ASU2, SSO, agent restart are not hitless events for IS-IS SR LFIB routes or tunnels being protected by backup paths.
LAB
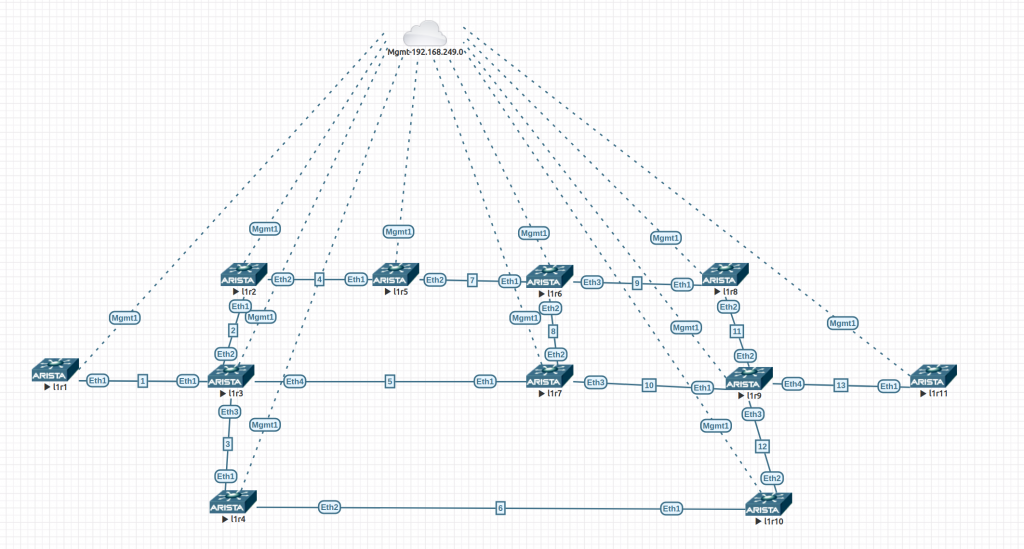
Based on this, I built a lab using 4.24.1.1F 64 bits on EVE-NG. All links have default ISIS cost of 10 (loopbacks are 1) and we have TI-LFA node-protection enabled globally.
Fig1. SR TI-LFA Lab
The config are quite simple. This is l1r9. The only change is the IP addressing. The links in the diagram show the third octet of the link address range.
!
service routing protocols model multi-agent
!
hostname l1r9
!
spanning-tree mode mstp
!
aaa authorization exec default local
!
no aaa root
!
vrf instance MGMT
!
interface Ethernet1
no switchport
ip address 10.0.10.2/30
isis enable CORE
isis network point-to-point
!
interface Ethernet2
no switchport
ip address 10.0.11.2/30
isis enable CORE
isis network point-to-point
!
interface Ethernet3
no switchport
ip address 10.0.12.1/30
isis enable CORE
isis network point-to-point
!
interface Ethernet4
no switchport
ip address 10.0.13.1/30
isis enable CORE
isis network point-to-point
!
interface Loopback1
description CORE Loopback
ip address 10.0.0.9/32
node-segment ipv4 index 9
isis enable CORE
isis metric 1
!
interface Management1
vrf MGMT
ip address 192.168.249.18/24
!
ip routing
ip routing vrf MGMT
!
ip route vrf MGMT 0.0.0.0/0 192.168.249.1
!
mpls ip
!
mpls label range isis-sr 800000 65536
!
router isis CORE
net 49.0000.0001.0010.0000.0000.0009.00
is-type level-2
log-adjacency-changes
timers local-convergence-delay protected-prefixes
set-overload-bit on-startup wait-for-bgp
!
address-family ipv4 unicast
bfd all-interfaces
fast-reroute ti-lfa mode node-protection
!
segment-routing mpls
router-id 10.0.0.9
no shutdown
adjacency-segment allocation sr-peers backup-eligible
!
management api http-commands
protocol unix-socket
no shutdown
!
vrf MGMT
no shutdown
!
Using this script (using nornir/napalm), I gather the output of all these commands from all routers:
"show isis segment-routing prefix-segments" -> shows if protection is enabled for these segments

"show isis segment-routing adjacency-segments" -> shows is protection is enabled for these segments

"show isis interface" -> shows state of protection configured

"show isis ti-lfa path" -> shows the repair path with the list of all the system IDs from the P-node to the Q-node for every destination/constraint tuple. You will see that even though node protection is configured a link protecting LFA is computed too. This is to fallback to link protecting LFAs whenever the node protecting LFA becomes unavailable.

"show isis ti-lfa tunnel" -> The TI-LFA repair tunnels are just internal constructs that are shared by multiple LFIB routes that compute similar repair paths. This command displays TI-LFA repair tunnels with the primary and backup via information.

"show isis segment-routing tunnel" -> command displays all the IS-IS SR tunnels. The field ‘ TI-LFA tunnel index ’ shows the index of the TI-LFA tunnel protecting the SR tunnel. The same TI-LFA tunnel that protects the LFIB route also protects the corresponding IS-IS SR tunnel.

"show tunnel fib" -> displays tunnels programmed in the tunnel FIB also includes the TI-LFA tunnels along with protected IS-IS SR tunnels.

"show mpls lfib route" -> displays the backup information along with the primary vias for all node/adjacency segments that have TI-LFA backup paths computed.

"show ip route" -> When services like LDP pseudowires, BGP LU, L2 EVPN or L3 MPLS VPN use IS-IS SR tunnels as an underlay, they are automatically protected by TI-LFA tunnels that protect the IS-IS SR tunnels. The ‘show ip route’ command displays the hierarchy of the overlay-underlay-TI-LFA tunnels like below.
This is the output of l1r3 in the initial state (no failures):
/////////////////////////////////////////////////////////////////////////
///                               Device: l1r3                         //      /////////////////////////////////////////////////////////////////////////

command = show isis segment-routing prefix-segments


System ID: 0000.0000.0003			Instance: 'CORE'
SR supported Data-plane: MPLS			SR Router ID: 10.0.0.3

Node: 11     Proxy-Node: 0      Prefix: 0       Total Segments: 11

Flag Descriptions: R: Re-advertised, N: Node Segment, P: no-PHP
                   E: Explicit-NULL, V: Value, L: Local
Segment status codes: * - Self originated Prefix, L1 - level 1, L2 - level 2
  Prefix                      SID Type       Flags                   System ID       Level Protection
  ------------------------- ----- ---------- ----------------------- --------------- ----- ----------
  10.0.0.1/32                   1 Node       R:0 N:1 P:0 E:0 V:0 L:0 0000.0000.0001  L2    node
  10.0.0.2/32                   2 Node       R:0 N:1 P:0 E:0 V:0 L:0 0000.0000.0002  L2    node
* 10.0.0.3/32                   3 Node       R:0 N:1 P:0 E:0 V:0 L:0 0000.0000.0003  L2    unprotected
  10.0.0.4/32                   4 Node       R:0 N:1 P:0 E:0 V:0 L:0 0000.0000.0004  L2    node
  10.0.0.5/32                   5 Node       R:0 N:1 P:0 E:0 V:0 L:0 0000.0000.0005  L2    node
  10.0.0.6/32                   6 Node       R:0 N:1 P:0 E:0 V:0 L:0 0000.0000.0006  L2    node
  10.0.0.7/32                   7 Node       R:0 N:1 P:0 E:0 V:0 L:0 0000.0000.0007  L2    node
  10.0.0.8/32                   8 Node       R:0 N:1 P:0 E:0 V:0 L:0 0000.0000.0008  L2    node
  10.0.0.9/32                   9 Node       R:0 N:1 P:0 E:0 V:0 L:0 0000.0000.0009  L2    node
  10.0.0.10/32                 10 Node       R:0 N:1 P:0 E:0 V:0 L:0 0000.0000.0010  L2    node
  10.0.0.11/32                 11 Node       R:0 N:1 P:0 E:0 V:0 L:0 0000.0000.0011  L2    node

================================================================================

command = show isis segment-routing adjacency-segments


System ID: l1r3			Instance: CORE
SR supported Data-plane: MPLS			SR Router ID: 10.0.0.3
Adj-SID allocation mode: SR-adjacencies
Adj-SID allocation pool: Base: 100000     Size: 16384
Adjacency Segment Count: 4
Flag Descriptions: F: Ipv6 address family, B: Backup, V: Value
                   L: Local, S: Set

Segment Status codes: L1 - Level-1 adjacency, L2 - Level-2 adjacency, P2P - Point-to-Point adjacency, LAN - Broadcast adjacency

Locally Originated Adjacency Segments
Adj IP Address  Local Intf     SID   SID Source                 Flags     Type
--------------- ----------- ------- ------------ --------------------- --------
      10.0.1.1         Et1  100000      Dynamic   F:0 B:1 V:1 L:1 S:0   P2P L2
      10.0.2.1         Et2  100001      Dynamic   F:0 B:1 V:1 L:1 S:0   P2P L2
      10.0.5.2         Et4  100002      Dynamic   F:0 B:1 V:1 L:1 S:0   P2P L2
      10.0.3.2         Et3  100003      Dynamic   F:0 B:1 V:1 L:1 S:0   P2P L2

Protection
----------
      node
      node
      node
      node


================================================================================

command = show isis interface


IS-IS Instance: CORE VRF: default

  Interface Loopback1:
    Index: 12 SNPA: 0:0:0:0:0:0
    MTU: 65532 Type: loopback
    Area Proxy Boundary is Disabled
    Node segment Index IPv4: 3
    BFD IPv4 is Enabled
    BFD IPv6 is Disabled
    Hello Padding is Enabled
    Level 2:
      Metric: 1 (Passive Interface)
      Authentication mode: None
      TI-LFA protection is disabled for IPv4
      TI-LFA protection is disabled for IPv6
  Interface Ethernet1:
    Index: 13 SNPA: P2P
    MTU: 1497 Type: point-to-point
    Area Proxy Boundary is Disabled
    BFD IPv4 is Enabled
    BFD IPv6 is Disabled
    Hello Padding is Enabled
    Level 2:
      Metric: 10, Number of adjacencies: 1
      Link-ID: 0D
      Authentication mode: None
      TI-LFA node protection is enabled for the following IPv4 segments: node segments, adjacency segments
      TI-LFA protection is disabled for IPv6
  Interface Ethernet2:
    Index: 14 SNPA: P2P
    MTU: 1497 Type: point-to-point
    Area Proxy Boundary is Disabled
    BFD IPv4 is Enabled
    BFD IPv6 is Disabled
    Hello Padding is Enabled
    Level 2:
      Metric: 10, Number of adjacencies: 1
      Link-ID: 0E
      Authentication mode: None
      TI-LFA node protection is enabled for the following IPv4 segments: node segments, adjacency segments
      TI-LFA protection is disabled for IPv6
  Interface Ethernet3:
    Index: 15 SNPA: P2P
    MTU: 1497 Type: point-to-point
    Area Proxy Boundary is Disabled
    BFD IPv4 is Enabled
    BFD IPv6 is Disabled
    Hello Padding is Enabled
    Level 2:
      Metric: 10, Number of adjacencies: 1
      Link-ID: 0F
      Authentication mode: None
      TI-LFA node protection is enabled for the following IPv4 segments: node segments, adjacency segments
      TI-LFA protection is disabled for IPv6
  Interface Ethernet4:
    Index: 16 SNPA: P2P
    MTU: 1497 Type: point-to-point
    Area Proxy Boundary is Disabled
    BFD IPv4 is Enabled
    BFD IPv6 is Disabled
    Hello Padding is Enabled
    Level 2:
      Metric: 10, Number of adjacencies: 1
      Link-ID: 10
      Authentication mode: None
      TI-LFA node protection is enabled for the following IPv4 segments: node segments, adjacency segments
      TI-LFA protection is disabled for IPv6

================================================================================

command = show isis ti-lfa path

TI-LFA paths for IPv4 address family
   Topo-id: Level-2
   Destination       Constraint                     Path
----------------- --------------------------------- --------------
   l1r2              exclude node 0000.0000.0002    Path not found
                     exclude Ethernet2              l1r6
   l1r8              exclude Ethernet4              l1r4
                     exclude node 0000.0000.0007    l1r4
   l1r9              exclude Ethernet4              l1r4
                     exclude node 0000.0000.0007    l1r4
   l1r11             exclude Ethernet4              l1r4
                     exclude node 0000.0000.0007    l1r4
   l1r10             exclude Ethernet3              l1r7
                     exclude node 0000.0000.0004    l1r7
   l1r1              exclude node 0000.0000.0001    Path not found
                     exclude Ethernet1              Path not found
   l1r6              exclude Ethernet4              l1r2
                     exclude node 0000.0000.0007    l1r2
   l1r7              exclude node 0000.0000.0007    Path not found
                     exclude Ethernet4              l1r10
   l1r4              exclude Ethernet3              l1r9
                     exclude node 0000.0000.0004    Path not found
   l1r5              exclude Ethernet2              l1r7
                     exclude node 0000.0000.0002    l1r7


================================================================================

command = show isis ti-lfa tunnel

Tunnel Index 2
   via 10.0.5.2, 'Ethernet4'
      label stack 3
   backup via 10.0.3.2, 'Ethernet3'
      label stack 3
Tunnel Index 4
   via 10.0.3.2, 'Ethernet3'
      label stack 3
   backup via 10.0.5.2, 'Ethernet4'
      label stack 3
Tunnel Index 6
   via 10.0.3.2, 'Ethernet3'
      label stack 3
   backup via 10.0.5.2, 'Ethernet4'
      label stack 800009 800004
Tunnel Index 7
   via 10.0.5.2, 'Ethernet4'
      label stack 3
   backup via 10.0.3.2, 'Ethernet3'
      label stack 800010 800007
Tunnel Index 8
   via 10.0.2.1, 'Ethernet2'
      label stack 3
   backup via 10.0.5.2, 'Ethernet4'
      label stack 800006 800002
Tunnel Index 9
   via 10.0.5.2, 'Ethernet4'
      label stack 3
   backup via 10.0.2.1, 'Ethernet2'
      label stack 3
Tunnel Index 10
   via 10.0.2.1, 'Ethernet2'
      label stack 3
   backup via 10.0.5.2, 'Ethernet4'
      label stack 3

================================================================================

command = show isis segment-routing tunnel

 Index    Endpoint         Nexthop      Interface     Labels       TI-LFA
                                                                   tunnel index
-------- --------------- ------------ ------------- -------------- ------------
 1        10.0.0.1/32      10.0.1.1     Ethernet1     [ 3 ]        -
 2        10.0.0.2/32      10.0.2.1     Ethernet2     [ 3 ]        8
 3        10.0.0.7/32      10.0.5.2     Ethernet4     [ 3 ]        7
 4        10.0.0.4/32      10.0.3.2     Ethernet3     [ 3 ]        6
 5        10.0.0.9/32      10.0.5.2     Ethernet4     [ 800009 ]   2
 6        10.0.0.10/32     10.0.3.2     Ethernet3     [ 800010 ]   4
 7        10.0.0.11/32     10.0.5.2     Ethernet4     [ 800011 ]   2
 8        10.0.0.8/32      10.0.5.2     Ethernet4     [ 800008 ]   2
 9        10.0.0.6/32      10.0.5.2     Ethernet4     [ 800006 ]   9
 10       10.0.0.5/32      10.0.2.1     Ethernet2     [ 800005 ]   10


================================================================================

command = show tunnel fib


Type 'IS-IS SR', index 1, endpoint 10.0.0.1/32, forwarding None
   via 10.0.1.1, 'Ethernet1' label 3

Type 'IS-IS SR', index 2, endpoint 10.0.0.2/32, forwarding None
   via TI-LFA tunnel index 8 label 3
      via 10.0.2.1, 'Ethernet2' label 3
      backup via 10.0.5.2, 'Ethernet4' label 800006 800002

Type 'IS-IS SR', index 3, endpoint 10.0.0.7/32, forwarding None
   via TI-LFA tunnel index 7 label 3
      via 10.0.5.2, 'Ethernet4' label 3
      backup via 10.0.3.2, 'Ethernet3' label 800010 800007

Type 'IS-IS SR', index 4, endpoint 10.0.0.4/32, forwarding None
   via TI-LFA tunnel index 6 label 3
      via 10.0.3.2, 'Ethernet3' label 3
      backup via 10.0.5.2, 'Ethernet4' label 800009 800004

Type 'IS-IS SR', index 5, endpoint 10.0.0.9/32, forwarding None
   via TI-LFA tunnel index 2 label 800009
      via 10.0.5.2, 'Ethernet4' label 3
      backup via 10.0.3.2, 'Ethernet3' label 3

Type 'IS-IS SR', index 6, endpoint 10.0.0.10/32, forwarding None
   via TI-LFA tunnel index 4 label 800010
      via 10.0.3.2, 'Ethernet3' label 3
      backup via 10.0.5.2, 'Ethernet4' label 3

Type 'IS-IS SR', index 7, endpoint 10.0.0.11/32, forwarding None
   via TI-LFA tunnel index 2 label 800011
      via 10.0.5.2, 'Ethernet4' label 3
      backup via 10.0.3.2, 'Ethernet3' label 3

Type 'IS-IS SR', index 8, endpoint 10.0.0.8/32, forwarding None
   via TI-LFA tunnel index 2 label 800008
      via 10.0.5.2, 'Ethernet4' label 3
      backup via 10.0.3.2, 'Ethernet3' label 3

Type 'IS-IS SR', index 9, endpoint 10.0.0.6/32, forwarding None
   via TI-LFA tunnel index 9 label 800006
      via 10.0.5.2, 'Ethernet4' label 3
      backup via 10.0.2.1, 'Ethernet2' label 3

Type 'IS-IS SR', index 10, endpoint 10.0.0.5/32, forwarding None
   via TI-LFA tunnel index 10 label 800005
      via 10.0.2.1, 'Ethernet2' label 3
      backup via 10.0.5.2, 'Ethernet4' label 3

Type 'TI-LFA', index 2, forwarding None
   via 10.0.5.2, 'Ethernet4' label 3
   backup via 10.0.3.2, 'Ethernet3' label 3

Type 'TI-LFA', index 4, forwarding None
   via 10.0.3.2, 'Ethernet3' label 3
   backup via 10.0.5.2, 'Ethernet4' label 3

Type 'TI-LFA', index 6, forwarding None
   via 10.0.3.2, 'Ethernet3' label 3
   backup via 10.0.5.2, 'Ethernet4' label 800009 800004

Type 'TI-LFA', index 7, forwarding None
   via 10.0.5.2, 'Ethernet4' label 3
   backup via 10.0.3.2, 'Ethernet3' label 800010 800007

Type 'TI-LFA', index 8, forwarding None
   via 10.0.2.1, 'Ethernet2' label 3
   backup via 10.0.5.2, 'Ethernet4' label 800006 800002

Type 'TI-LFA', index 9, forwarding None
   via 10.0.5.2, 'Ethernet4' label 3
   backup via 10.0.2.1, 'Ethernet2' label 3

Type 'TI-LFA', index 10, forwarding None
   via 10.0.2.1, 'Ethernet2' label 3
   backup via 10.0.5.2, 'Ethernet4' label 3

================================================================================

command = show mpls lfib route

MPLS forwarding table (Label [metric] Vias) - 14 routes
MPLS next-hop resolution allow default route: False
Via Type Codes:
          M - MPLS via, P - Pseudowire via,
          I - IP lookup via, V - VLAN via,
          VA - EVPN VLAN aware via, ES - EVPN ethernet segment via,
          VF - EVPN VLAN flood via, AF - EVPN VLAN aware flood via,
          NG - Nexthop group via
Source Codes:
          G - gRIBI, S - Static MPLS route,
          B2 - BGP L2 EVPN, B3 - BGP L3 VPN,
          R - RSVP, LP - LDP pseudowire,
          L - LDP, M - MLDP,
          IP - IS-IS SR prefix segment, IA - IS-IS SR adjacency segment,
          IL - IS-IS SR segment to LDP, LI - LDP to IS-IS SR segment,
          BL - BGP LU, ST - SR TE policy,
          DE - Debug LFIB

 IA  100000   [1]
                via M, 10.0.1.1, pop
                 payload autoDecide, ttlMode uniform, apply egress-acl
                 interface Ethernet1
 IA  100001   [1]
                via TI-LFA tunnel index 8, pop
                 payload autoDecide, ttlMode uniform, apply egress-acl
                    via 10.0.2.1, Ethernet2, label imp-null(3)
                    backup via 10.0.5.2, Ethernet4, label 800006 800002
 IA  100002   [1]
                via TI-LFA tunnel index 7, pop
                 payload autoDecide, ttlMode uniform, apply egress-acl
                    via 10.0.5.2, Ethernet4, label imp-null(3)
                    backup via 10.0.3.2, Ethernet3, label 800010 800007
 IA  100003   [1]
                via TI-LFA tunnel index 6, pop
                 payload autoDecide, ttlMode uniform, apply egress-acl
                    via 10.0.3.2, Ethernet3, label imp-null(3)
                    backup via 10.0.5.2, Ethernet4, label 800009 800004
 IP  800001   [1], 10.0.0.1/32
                via M, 10.0.1.1, pop
                 payload autoDecide, ttlMode uniform, apply egress-acl
                 interface Ethernet1
 IP  800002   [1], 10.0.0.2/32
                via TI-LFA tunnel index 8, pop
                 payload autoDecide, ttlMode uniform, apply egress-acl
                    via 10.0.2.1, Ethernet2, label imp-null(3)
                    backup via 10.0.5.2, Ethernet4, label 800006 800002
 IP  800004   [1], 10.0.0.4/32
                via TI-LFA tunnel index 6, pop
                 payload autoDecide, ttlMode uniform, apply egress-acl
                    via 10.0.3.2, Ethernet3, label imp-null(3)
                    backup via 10.0.5.2, Ethernet4, label 800009 800004
 IP  800005   [1], 10.0.0.5/32
                via TI-LFA tunnel index 10, swap 800005
                 payload autoDecide, ttlMode uniform, apply egress-acl
                    via 10.0.2.1, Ethernet2, label imp-null(3)
                    backup via 10.0.5.2, Ethernet4, label imp-null(3)
 IP  800006   [1], 10.0.0.6/32
                via TI-LFA tunnel index 9, swap 800006
                 payload autoDecide, ttlMode uniform, apply egress-acl
                    via 10.0.5.2, Ethernet4, label imp-null(3)
                    backup via 10.0.2.1, Ethernet2, label imp-null(3)
 IP  800007   [1], 10.0.0.7/32
                via TI-LFA tunnel index 7, pop
                 payload autoDecide, ttlMode uniform, apply egress-acl
                    via 10.0.5.2, Ethernet4, label imp-null(3)
                    backup via 10.0.3.2, Ethernet3, label 800010 800007
 IP  800008   [1], 10.0.0.8/32
                via TI-LFA tunnel index 2, swap 800008
                 payload autoDecide, ttlMode uniform, apply egress-acl
                    via 10.0.5.2, Ethernet4, label imp-null(3)
                    backup via 10.0.3.2, Ethernet3, label imp-null(3)
 IP  800009   [1], 10.0.0.9/32
                via TI-LFA tunnel index 2, swap 800009
                 payload autoDecide, ttlMode uniform, apply egress-acl
                    via 10.0.5.2, Ethernet4, label imp-null(3)
                    backup via 10.0.3.2, Ethernet3, label imp-null(3)
 IP  800010   [1], 10.0.0.10/32
                via TI-LFA tunnel index 4, swap 800010
                 payload autoDecide, ttlMode uniform, apply egress-acl
                    via 10.0.3.2, Ethernet3, label imp-null(3)
                    backup via 10.0.5.2, Ethernet4, label imp-null(3)
 IP  800011   [1], 10.0.0.11/32
                via TI-LFA tunnel index 2, swap 800011
                 payload autoDecide, ttlMode uniform, apply egress-acl
                    via 10.0.5.2, Ethernet4, label imp-null(3)
                    backup via 10.0.3.2, Ethernet3, label imp-null(3)

================================================================================

command = show ip route


VRF: default
Codes: C - connected, S - static, K - kernel,
       O - OSPF, IA - OSPF inter area, E1 - OSPF external type 1,
       E2 - OSPF external type 2, N1 - OSPF NSSA external type 1,
       N2 - OSPF NSSA external type2, B - BGP, B I - iBGP, B E - eBGP,
       R - RIP, I L1 - IS-IS level 1, I L2 - IS-IS level 2,
       O3 - OSPFv3, A B - BGP Aggregate, A O - OSPF Summary,
       NG - Nexthop Group Static Route, V - VXLAN Control Service,
       DH - DHCP client installed default route, M - Martian,
       DP - Dynamic Policy Route, L - VRF Leaked,
       RC - Route Cache Route

Gateway of last resort is not set

 I L2     10.0.0.1/32 [115/11] via 10.0.1.1, Ethernet1
 I L2     10.0.0.2/32 [115/11] via 10.0.2.1, Ethernet2
 C        10.0.0.3/32 is directly connected, Loopback1
 I L2     10.0.0.4/32 [115/11] via 10.0.3.2, Ethernet3
 I L2     10.0.0.5/32 [115/21] via 10.0.2.1, Ethernet2
 I L2     10.0.0.6/32 [115/21] via 10.0.5.2, Ethernet4
 I L2     10.0.0.7/32 [115/11] via 10.0.5.2, Ethernet4
 I L2     10.0.0.8/32 [115/31] via 10.0.5.2, Ethernet4
 I L2     10.0.0.9/32 [115/21] via 10.0.5.2, Ethernet4
 I L2     10.0.0.10/32 [115/21] via 10.0.3.2, Ethernet3
 I L2     10.0.0.11/32 [115/31] via 10.0.5.2, Ethernet4
 C        10.0.1.0/30 is directly connected, Ethernet1
 C        10.0.2.0/30 is directly connected, Ethernet2
 C        10.0.3.0/30 is directly connected, Ethernet3
 I L2     10.0.4.0/30 [115/20] via 10.0.2.1, Ethernet2
 C        10.0.5.0/30 is directly connected, Ethernet4
 I L2     10.0.6.0/30 [115/20] via 10.0.3.2, Ethernet3
 I L2     10.0.7.0/30 [115/30] via 10.0.2.1, Ethernet2
                               via 10.0.5.2, Ethernet4
 I L2     10.0.8.0/30 [115/20] via 10.0.5.2, Ethernet4
 I L2     10.0.9.0/30 [115/30] via 10.0.5.2, Ethernet4
 I L2     10.0.10.0/30 [115/20] via 10.0.5.2, Ethernet4
 I L2     10.0.11.0/30 [115/30] via 10.0.5.2, Ethernet4
 I L2     10.0.12.0/30 [115/30] via 10.0.3.2, Ethernet3
                                via 10.0.5.2, Ethernet4
 I L2     10.0.13.0/30 [115/30] via 10.0.5.2, Ethernet4


================================================================================
In l1r3 we can see:
show isis segment-routing prefix-segments: all prefix segments are under “node” protection (apart from itself – 10.0.0.3/32)
show isis segment-routing adjacency-segments: all adjacent segments are under “node” protection.
show isis interface: All isis enabled interfaces (apart from loopback1) have TI-LFA node protection enabled for ipv4.
show isis ti-lfa path: Here we can see link and node protection to all possible destinations in our ISIS domain (all P routers in our BGP-Free core). When node protection is not possible, link protection is calculated. The exception is l1r1 because it has only one link into the networks, so if that is lost, there is no backup at all.
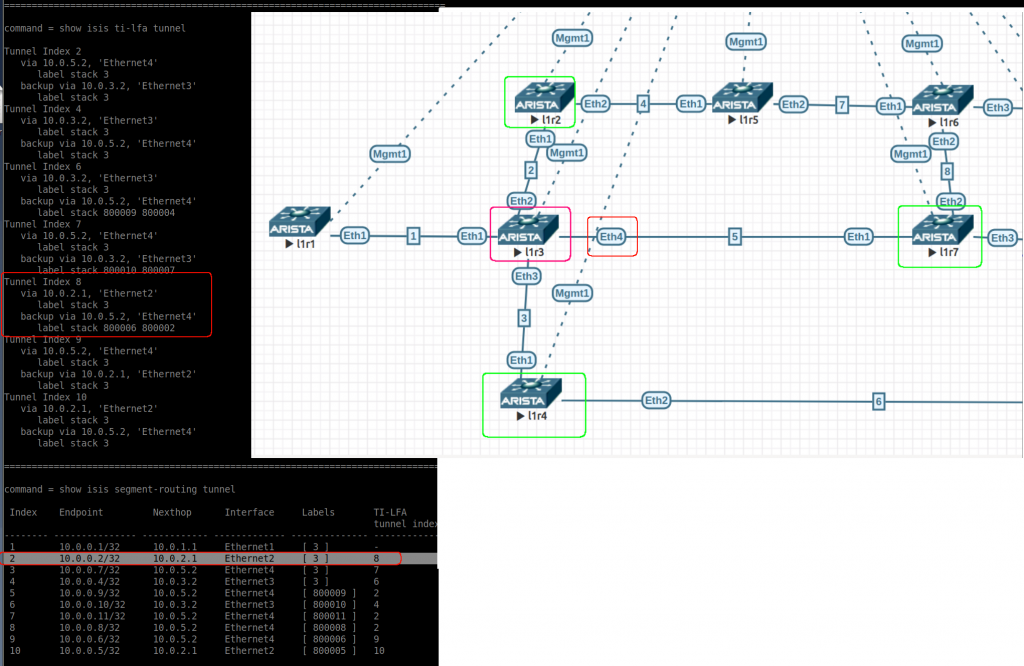
show isis ti-lfa tunnel: This can be confusing. These are the TI-LFA tunnels, the first two lines refer to the path they are protecting. The last two lines are really the tunnel configuration. Another interesting thing here is the label stack for some backup tunnels (index 6, 7, 8). This a way to avoid a loop. The index is used in the next command.
show isis segment-routing tunnel: Here we see the current SR tunnels and the corresponding backup (index that refers to above command). Label [3] is the implicit null label. Paying attention to the endpoint “10.0.0.2/32” (as per fig2 below). We can see the primary path is via eth2. The backup is via tunnel index 8 (via eth4 – l1r7). If you check the path to “10.0.0.2/32 – 800002” from l1r7 (output after fig2) you can see it is pointing back to l1r3 and we would have a loop! For this reason the backup tunnel index 8 in l1r3 has a label stack to avoid this loop (800006 800002). Once l1r7 received this packet and checks the segment labels, it sends the packet to 800006 via eth2 (l1r6) and then l1r6 uses 8000002 to reach finally l1r2 (via l1r5).
show tunnel fib: you can see all “IS-IS SR” and “TI-LFA” tunnels defined. It is like a merge of “show isis segment-routing tunnel” and “show isis ti-lfa tunnel”.
show mpls lfib route: You can see the programmed labels and TI-LFA. I’ve got confused when I see “imp-null” and the I see some pop/swap for the same entry…
show ip route: nothing really interesting without L3VPNS
Testing
Ok, you need to generate traffic that is labelled to really test TI-LFA and with enough packet rate to see if you are close to the 50ms recovery promissed.
So I have had to make some changes:
create a L3VPN CUST-A (evpn) in l1r3 and l1r9, so they are PEs
l1r1 and l1r11 are CPE in VRF CUST-A
All other devices have no changes
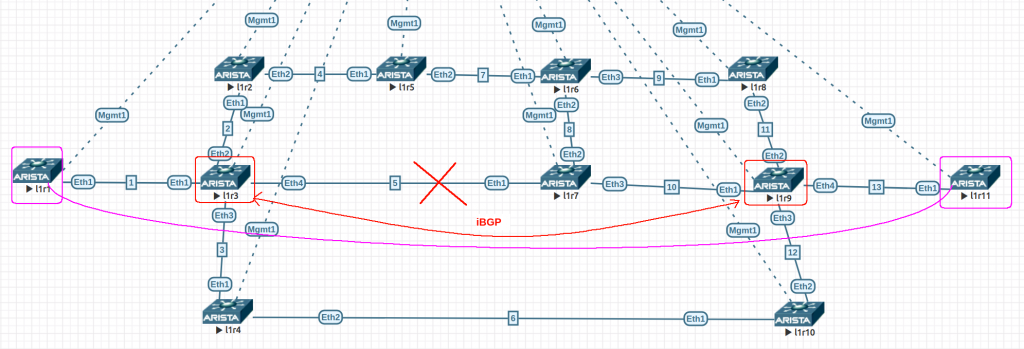
We need to test with and without TI-LFA enabled. The test I have do is to ping from l1r1 to l1r11 and dropping the link l1r3-l1r7, while l1r3 has enabled/disabled TI-LFA.
Fig3 – Testing Scenario
Routing changes with TI-LFA enabled
BEFORE DROPPING LINK
======

l1r3#show ip route vrf CUST-A

 B I      10.0.13.0/30 [200/0] via 10.0.0.9/32, IS-IS SR tunnel index 5, label 116384
                                  via TI-LFA tunnel index 4, label 800009
                                     via 10.0.5.2, Ethernet4, label imp-null(3)
                                     backup via 10.0.3.2, Ethernet3, label imp-null(3)
 C        192.168.0.3/32 is directly connected, Loopback2
 B I      192.168.0.9/32 [200/0] via 10.0.0.9/32, IS-IS SR tunnel index 5, label 116384
                                    via TI-LFA tunnel index 4, label 800009
                                       via 10.0.5.2, Ethernet4, label imp-null(3)
                                       backup via 10.0.3.2, Ethernet3, label imp-null(3)

AFTER DROPPING LINK
======

l1r3#show ip route vrf CUST-A

 B I      10.0.13.0/30 [200/0] via 10.0.0.9/32, IS-IS SR tunnel index 5, label 116384
                                  via TI-LFA tunnel index 11, label 800009
                                     via 10.0.3.2, Ethernet3, label imp-null(3)
                                     backup via 10.0.2.1, Ethernet2, label 800005
 C        192.168.0.3/32 is directly connected, Loopback2
 B I      192.168.0.9/32 [200/0] via 10.0.0.9/32, IS-IS SR tunnel index 5, label 116384
                                    via TI-LFA tunnel index 11, label 800009
                                       via 10.0.3.2, Ethernet3, label imp-null(3)
This is a very good presentation about optical stuff from NANOG 70 (2017). And I noticed there is an updated version from NANOG 77 (2019). I watched the 2017 (2h) and there is something always bites me: db vs dbm
Close to the end, there are some common questions about optical that he provides answers. I liked the ones about “looking at the lasers can make you blind” and the point that is worth cleaning your fibers. A bit about cleaning here.
I have been cleaning up my email box and found some interesting stuff. This is from APNIC regarding a new approach to deploy multicast. Slides from nanog page (check tuesday) In my former employer, we suffered traffic congestion several times after some famous games got new updates. So it is interesting that Akamai is trying to deploy inter-domain multicast in the internet. They have a massive network and I guess they suffered with those updates and this is an attempt to “digest” better those spikes. At minute 16 you can see the network changes required. It doesnt look like a quick/easy change but would be a great thing to happen.
And reading a nanog conversation about 5G I realised that this technology promises high bandwidth (and that could fix the issue of requiring multicast). But still we should have a smarter way to deliver same content to eyeball networks?
From the nanog thread, there are several links to videos about 5G like this from verizon that gives the vision from a big provider and its providers (not technical). This one is more technical with 5G terms (I lost contact of Telco term with early 4G). As well, I see mentioning kubernetes in 5G deployments quite often. I guess something new to learn.
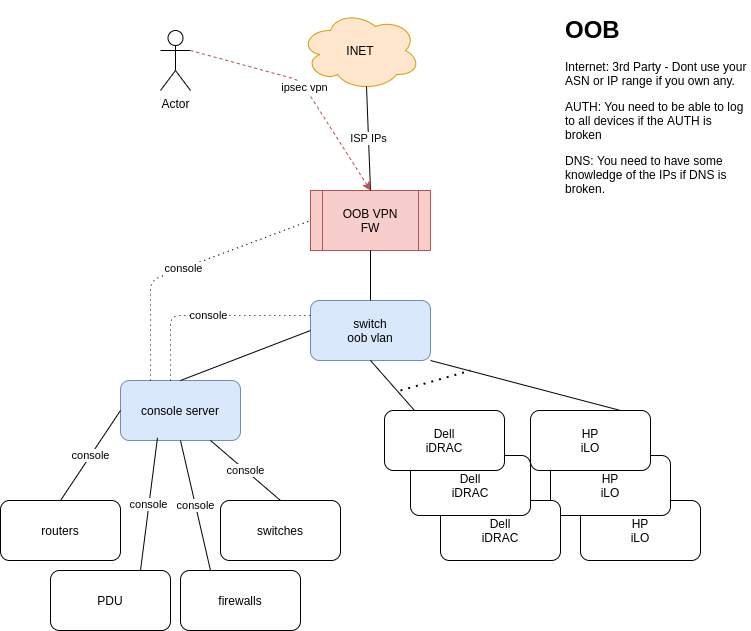
I was reading this blog and realised that OOB is something is not talked about very often. Based on what I have seen in my career:
Design
You need to sell the idea that this is a must. Then you need to secure some budget. You dont need much:
1x switch
1x firewall
1x Internet access (if you have your ASN and IP range, dont use it)
Keep it simple..
Most network kit (firewalls, routers, switches, pdus, console servers, etc) have 1xmgmt port and 1xconsole port. So all those need to go to the console server. I guess most server vendors offer some OOB access (I just know Dell and HP). So all those go to the oob switch.
If you have a massive network with hundreds of devices/servers, then you will need more oob switches and console servers. You still need just one firewall and 1 internet connection. The blog comments about the spine-leaf oob network. I guess this is the way for a massive network/DC.
Access to OOB
You need to be able to access it via your corporate network and from anywhere in the internet.
You need to be sure linux/windows/macs can VPN.
Use very strong passwords and keys.
You need to be sure the oob firewall is quite tight in access. At the end of the day you only want to allow ssh to the console server and https to the ILO/iDRACS. Nothing initiated internally can go to the internet.
Dependencies
Think in the worse scenario. Your DNS server is down. Your authentication is down.
You need to be sure you have local auth enabled in all devices for emergency
You need to work out some DNS service. Write the key IPs in the documentation?
You IP transit has to be reliable. You dont need a massive pipe but you need to be sure it is up.
Monitoring
You dont want to be in the middle of the outage and realise that your OOB is not functional. You need to be sure the ISP for the OOB is up and the devices (oob switch and oob firewall) are functional all the time.
Another point frequently lost. You need to be sure people can find info about the OOB: how is built and how to access it.
Training
At the end of the day, if you have a super OOB network but then nobody knows how to connect and use it, then it is useful. Schedule routine checkups with the team to be sure everybody can OOB. This is useful when you get a call at 3am.
Diagram
Update
Funny enough, I was watching today NLNOG live and there was a presentation about OOB with too different approaches: in-band out-of-band and pure out-of-band.
From the NTT side, I liked the comment about conserver.com to manage your serial connections. I will try to use it once I have access to a new network.