This week a colleague pass this link about running kubernetes cluster running on Cilium. The interesting point is the high throughput is achieved by BIG TCP and IPv6!
The summary (copied) is:
TCP segments in the OS are up to 65K, NIC hardware does the segmentation – we do this now, but the 65K is a limitation of IPv4 addressing. BIG TCP uses IPv6 and allows much large TCP segments within OS currently 512K but theoretically higher. End result – better perf (>20% higher in this video) and latency (2.2x faster through the OS).
Then I saw this other video from John Ousterhout. It is similar topic as the Kubernetes video above as K8S is used mainly in datacenters.
High performance: – data throughput: full link speed for large messages – low tail latency: <10us for short messages? (DC) – message throughput: 100M short messages per second? (DC)
TCP issues in DC: 1- stream oriented (no load balancing) -> message based 2- connection oriented (can break infiniband!, expensive,)-> connectionless 3- fair scheduling (bw sharing) -> run to completion (SRPT) 4- sender-driven congestion control (based on buffer occupancy) -> receiver- driven congestion control 5- in-order delivery -> no ordering requirements
As well, it is important the move to NIC (as there is already a lot of NIC offloading).
His proposal for HOMA looks very nice but I like how he explains how dificult is going to be successful. Still worth trying.
$ docker run -p 127.0.0.1:80:8080/tcp ubuntu bash

This binds port 8080 of the container to TCP port 80 on 127.0.0.1 of the host machine. You can also specify udp and sctp ports. The Docker User Guide explains in detail how to manipulate ports in Docker.
3) HTTP status codes:
1xx informational
2xx Successful
 201 created
 204 no content (post received by server)
3xx Redirect
 301 moved permanently - future requests should be directed to the given URI
 302 found - requested resource resides temporally under a different URI
 304 not modified
4xx Client Error
 400 bad request
 401 unauthorized (user not authenticated or failed)
 403 forbidden (need permissions)
 404 not found
5xx Server Error
 500 internal server err - generic error message
 501 not implemented
 503 service unavailable
Basic: For "Basic" authentication the credentials are constructed by first combining the username and the password with a colon (aladdin:opensesame), and then by encoding the resulting string in base64 (YWxhZGRpbjpvcGVuc2VzYW1l).
The first two lines of this output show us information about file 1 and file 2. It lists the file name, modification date, and modification time of each of our files, one per line.
The lines below display the content of the files and how to modify file1.txt to make it identical to file2.txt.
- (minus) – it needs to be deleted from the first file. + (plus) – it needs to be added to the first file.
The next line has two at sign @ followed by a line range from the first file (in our case lines 1 through 4, separated by a comma) prefixed by “-“ and then space and then again followed by a line range from the second file prefixed by “+” and at the end two at sign @. Followed by the file content in output tells us which line remain unchanged and which lines needs to added or deleted(indicated by symbols) in the file 1 to make it identical to file 2.
.assertEqual(a, b)	a == b
.assertTrue(x)	        bool(x) is True
.assertFalse(x)	        bool(x) is False
.assertIs(a, b)	        a is b
.assertIsNone(x)	x is None
.assertIn(a, b)	        a in b
.assertIsInstance(a, b)	isinstance(a, b)

*** .assertIs(), .assertIsNone(), .assertIn(), and .assertIsInstance() all have opposite methods, named .assertIsNot(), and so forth.
We have had an issue with broadcast storms in our network. Checking the CoPP setup in the switches, we could see massive drops of ARP. This is a good link to know how to check CoPP drops in NXOS.
N9K:# show copp status
N9K# show policy-map interface control-plane | grep 'dropped [1-9]' | diff
Having so many ARP drops by CoPP is bad because very likely good ARP requests are going to be dropped.
Initially i thought it was related to ARP problems in EVPN like this link. But after taking a packet capture in a switch from an interface connected to a server, I could see that over 90% ARP traffic coming from the server was not getting a reply…. Checking in different switches, I could see the same pattern all over the place.
So why the server was making so many ARP requests?
After some time, managed to help help from a sysadmin with access to the servers so could troubleshoot the problem.
But, how do you find the process that is triggering the ARP requests? I didnt make the effort to think about it and started to search for an easy answer. This post gave me a clue.
ss does show you connections that have not yet been resolved by arp. They are in state SYN-SENT. The problem is that such a state is only held for a few seconds then the connection fails, so you may not see it. You could try rapid polling for it with

while ! ss -p state syn-sent | grep 1.1.1.100; do sleep .1; done
Somehow I couldnt see anything anything with “ss” so tried netstat as it shows you too the status of the TCP connection (I wonder what would happen is the connection was UDP instead???)
Initially I tried “netstat -a” and it was too slow to show me “SYN-SENT” status
Shame on me, I had to search how to get to show the ports quickly here:
We could see that the destination port was TCP 179, so something in the node was trying to talk BGP! They were “bird” processes. As the node belonged to a kubernetes cluster, we could see a calico container as CNI. Then we connected to the container and tried to check the bird config. We could see clearly the IPs that dont get ARP reply were configured there.
So in summary, basic TCP:
Very summarize, TCP is L4, then goes down to L3 IP. For getting to L2, you need to know the MAC of the IP, so that triggers the ARP request. Once the MAC is learned, it is cached for the next request. For that reason the first time you make a connection is slow (ping, traceroute, etc)
Now we need to workout why the calico/bird config is that way. Fix it to only use IPs of real BGP speakers and then verify the ARP storms stop.
Hopefully, I will learn a bit about calico.
Notes for UDP:
If I generate an UDP connection to a non-existing IP
$ nc -u 4.4.4.4 4000
netstat tells me the UDP connection is established and I can’t see anything in the ARP table for an external IP, for an internal IP (in my own network) I can see an incomplete entry. Why?
#  netstat -ntup | grep -i 4.4.4.4
udp        0      0 192.168.1.203:42653     4.4.4.4:4000            ESTABLISHED 102014/nc
#
#  netstat -ntup | grep -i '192.168.1.2:'
udp        0      0 192.168.1.203:44576     192.168.1.2:4000        ESTABLISHED 102369/nc
#
#
# arp -a
? (192.168.1.2) at <incomplete> on wlp2s0
something.mynet (192.168.1.1) at xx:xx:xx:yy:yy:zz [ether] on wlp2s0
#

# tcpdump -i wlp2s0 host 4.4.4.4
tcpdump: verbose output suppressed, use -v[v]... for full protocol decode
listening on wlp2s0, link-type EN10MB (Ethernet), snapshot length 262144 bytes
23:35:45.081819 IP 192.168.1.203.50186 > 4.4.4.4.4000: UDP, length 1
23:35:45.081850 IP 192.168.1.203.50186 > 4.4.4.4.4000: UDP, length 1
23:35:46.082075 IP 192.168.1.203.50186 > 4.4.4.4.4000: UDP, length 1
23:35:47.082294 IP 192.168.1.203.50186 > 4.4.4.4.4000: UDP, length 1
23:35:48.082504 IP 192.168.1.203.50186 > 4.4.4.4.4000: UDP, length 1
^C
5 packets captured
5 packets received by filter
0 packets dropped by kernel
#
UDP is stateless so we can’t have states…. so it is always going to be “established”. Basic TCP/UDP
When trying to open an UDP connection to an external IP, you need to “route” so my laptop knows it needs to send the UDP connection to the default gateway, so when getting to L2, the destination MAC address is not 4.4.4.4 is the default gateway MAC. BASIC ROUTING !!!! For that reason you dont see 4.4.4.4 in ARP table
When trying to open an UDP connection to a local IP, my laptop knows it is in the same network so it should be able to find the destination MAC address using ARP.
I wanted to read this book for some time. I thought it was going to be a technical book but it was a novel and felt like a thriller! and IT thriller if you can believe it. While I was reading it, I felt quite tense at some points, like, “I have been there!”. Although I am not a developer, I felt the pain mentioned in the book. I have been like that I spend many years in a good devops environment. When I started there, I didnt have a clue what devops menat but I learnt on the job training. I wish the networks world could be more “devops” but as we nearly always relay in 3rd party vendors to provide equipment, they always want you to lock in their product. Still, it is possible, but you need to have the drive (and time) and some support from your employer.
One of the things that surprise me from the devops methodology is that is based in manufacturing. I read in the past about Kaizen but now, I can see the connection. One of the main references is the book, The Goal.
And another very important point, nothing of these things work if people are not on board. You can have the smartest people around but if people dont buy in, nothing is accomplished.
So I like the idea of quick iterations (return of investment is received by the company and customer sooner) where you get earlier feedback, interactions and communication between all teams, awareness for the business that IT is everywhere, constant testing/experimentation (chaos monkey, antifragility), kanban boards / flow models to visualize process and constraints (WIP), constant learning, etc.
It was interesting at some point in the book where the main characters where interviewing the top people in the company to gather info about what is important for them and what means successful results and bad days. Then map all that to IT process. From there you can see what is clearly important and what is not. So you can focus in value.
Other things I learned is about the types of work we do:
Business projects
Internal projects
Changes
Unplanned work
And that unplanned work is the killer for any attempt to have a process like a manufacturing plant.
As well, based on “The Goal”, there are a lot of mentions about the “Three Ways”:
Find your constraint: maximize flow -> reduce batch, reduce intervals, increase quality to detect failures before moving to next steps.
Exploit your constraint: fast and constant flow of feedback.
Subordinate your constraint: high-trust culture -> dynamic, disciplined and scientific approach to experiment and risks.
In summary, I enjoyed the book. It was engaging, easy to digest and I learned!
After learning about kubernetes from kodekloud. I want to take a look at Terraform.
These are my notes that I am taking along the course.
1- Intro:
A- config mgmt: ansible, puppet, saltstack
Design to install and manage sw
B- Server Templating: docker, packer, vagrant.
Pre install sw and dependencies
vm or docker images
immutable infra
C- Provision tools: terraform, cloudformation
deploy immutable infra resources
servers, dbs, net components
multiple providers.
Terraform is available in AWS, GCP, Azure and physical machines. Multiple providers like cloudflare, paloalto, dns, infoblox, grafana, influxdb, mongodb, etc
It uses a declarative code HCL = HashiCorp Config Language: *.tf
Phases: Init, plan and apply.
2- Install and Basics
I am going to use my laptop initially, so I will follow the official instructions using a precompiled binary. So download the zip file (terraform_0.14.3_linux_amd64.zip), unzip and move the binary somewhere active in your path. I decided to use /usr/bin and install autocompletion.
/terraform/test1$ which terraform
 /usr/bin/terraform

/terraform/test1$ terraform version
 Terraform v0.14.3
 provider registry.terraform.io/hashicorp/local v2.0.0

/terraform/test1$ terraform -install-autocomplete
// This one use the resource "local_file". We call it "hello". It creates a file with specific content
$ vim local.tf
 resource "local_file" "hello" {
  filename = "/tmp/hello-terra.txt"
  content = "hello world1"
 }

Based on the above:
 block_name -> resource
 provider type -> local
 resource type -> file
 resource_name: hello
   arguments: filename and content


// The next ones use AWS provider types

$ vim aws-ec2.tf
 resource "aws_instance" "webserver" {
  ami = "ami-asdfasdf"
  instance_type = "t2.micro"
 }

$ vim aws-s3.tf
 resource "aws_s3_bucket" "data" {
   bucket = "webserver-bucket-org-2207"
   acl = "private"
 }
Deployment process:
 0- create *.tf file
 1- terraform init --> prepare env / install pluggins, etc
 2- terraform plan --> steps to be done // review
 3- terraform apply -> execute steps from plan
 4- terraform show
Example using “local_file” resource:
/terraform/test1$ terraform init
 Initializing the backend…
 Initializing provider plugins…
 Reusing previous version of hashicorp/local from the dependency lock file
 Installing hashicorp/local v2.0.0…
 Installed hashicorp/local v2.0.0 (signed by HashiCorp)
 Terraform has been successfully initialized!
 You may now begin working with Terraform. Try running "terraform plan" to see
 any changes that are required for your infrastructure. All Terraform commands
 should now work.
 If you ever set or change modules or backend configuration for Terraform,
 rerun this command to reinitialize your working directory. If you forget, other
 commands will detect it and remind you to do so if necessary.
/terraform/test1$
/terraform/test1$ terraform plan
 local_file.hello: Refreshing state… [id=c25325615b8492da77c2280a425a3aa82efda6d3]
 An execution plan has been generated and is shown below.
 Resource actions are indicated with the following symbols:
 create
 Terraform will perform the following actions:
 # local_file.hello will be created
 resource "local_file" "hello" { content              = "hello world1"
 directory_permission = "0777"
 file_permission      = "0700"
 filename             = "/tmp/hello-terra.txt"
 id                   = (known after apply)
 }
 Plan: 1 to add, 0 to change, 0 to destroy.

 Note: You didn't specify an "-out" parameter to save this plan, so Terraform
 can't guarantee that exactly these actions will be performed if
 "terraform apply" is subsequently run.
/terraform/test1$
/terraform/test1$ terraform apply
 local_file.hello: Refreshing state… [id=c25325615b8492da77c2280a425a3aa82efda6d3]
 An execution plan has been generated and is shown below.
 Resource actions are indicated with the following symbols:
 create
 Terraform will perform the following actions:
 # local_file.hello will be created
 resource "local_file" "hello" { content              = "hello world1"
 directory_permission = "0777"
 file_permission      = "0700"
 filename             = "/tmp/hello-terra.txt"
 id                   = (known after apply)
 }
 Plan: 1 to add, 0 to change, 0 to destroy.
 Do you want to perform these actions?
   Terraform will perform the actions described above.
   Only 'yes' will be accepted to approve.
 Enter a value: yes
 local_file.hello: Creating…
 local_file.hello: Creation complete after 0s [id=c25325615b8492da77c2280a425a3aa82efda6d3]
 Apply complete! Resources: 1 added, 0 changed, 0 destroyed.
/terraform/test1$
/terraform/test1$ cat /tmp/hello-terra.txt
 hello world1
Update/Destroy:
 $ update tf file
 $ terraform apply   -> apply the changes
or
 $ terraform destroy -> shows the destroy plan and then you need to confirm
Providers:
https://registry.terraform.io/
  oficial: aws, gcp, local, etc
  verified (3rdparty): bigip, heroku, digitalocena
  community: activedirectory, ucloud, netapp-gcps

$ terraform init -> show the providers installed

 plugin name format:
  * registry.terraform.io/hashicorp/local
           ^                ^         ^
       hostname      org namespace   type

plugins installed in .terraform/plugins

https://registry.terraform.io/providers/hashicorp/local/latest/docs/resources/file#sensitive_content
 main.tf: resource definition
 variables.tf: variable declarations
 outputs.tf: outouts from resources
 provider.tf: providers definition
Variables:
filename
content
prefix
separator
length
* type is optional
type: string "tst"
number 1
bool true/false
any whatever
list ["cat","dog"]
map pet1=cat
object mix of the above
tuple like a list of types
set (it is like a list but can't have duplicate values!)
Examples:
vim varibles.ttf
// List
variable "prefix" {
default = ["Mr", "Mrs", "Sir"] **default is optional!!!
type = list(string)
}
// Map
variable file-content {
type = map(string)
default = {
"state1" = "test1"
"state2" = "test2"
}
}
// Set
variable "prefix" {
default = ["10","11","12"]
type = set(number)
}
// Object
variable "bella" {
type = object({
name = string
age = number
food = list(string)
alive = bool
})
default = {
name = "bella"
age = 21
food = ["pasta", "tuna"]
alive = true
}
}
// Tuple
variable kitty {
type = tuple([string, number, bool)]
default = ["cat", 7, true]
}
Using variablesvim main.tf
resource "random_pet" "my-pet" {
prefix = var.prefix[0]
}
resource local_file my-file {
filename = "/tmp/test1.txt"
content = var.file-content["state1"]
}
Example using vars:
/terraform/vars$ cat variables.tf
variable "filename" {
  default = "/tmp/test-var.txt"
  type = string
  description = "xx"
 }
 variable "content" {
  default = "hello test var"
 }
/terraform/vars$ cat main.tf
resource "local_file" "test1" {
  filename = var.filename
  content = var.content
 }
/terraform/vars$
/terraform/vars$ terraform init
 Initializing the backend…
 Initializing provider plugins…
 Finding latest version of hashicorp/local…
 Installing hashicorp/local v2.0.0…
 Installed hashicorp/local v2.0.0 (signed by HashiCorp)
 Terraform has created a lock file .terraform.lock.hcl to record the provider
 selections it made above. Include this file in your version control repository
 so that Terraform can guarantee to make the same selections by default when
 you run "terraform init" in the future.
 Terraform has been successfully initialized!
 You may now begin working with Terraform. Try running "terraform plan" to see
 any changes that are required for your infrastructure. All Terraform commands
 should now work.
 If you ever set or change modules or backend configuration for Terraform,
 rerun this command to reinitialize your working directory. If you forget, other
 commands will detect it and remind you to do so if necessary.
/terraform/vars$
/terraform/vars$ terraform plan
 An execution plan has been generated and is shown below.
 Resource actions are indicated with the following symbols:
 create
 Terraform will perform the following actions:
 # local_file.test1 will be created
 resource "local_file" "test1" { content              = "hello test var"
 directory_permission = "0777"
 file_permission      = "0777"
 filename             = "/tmp/test-var.txt"
 id                   = (known after apply)
 }
 Plan: 1 to add, 0 to change, 0 to destroy.

 Note: You didn't specify an "-out" parameter to save this plan, so Terraform
 can't guarantee that exactly these actions will be performed if
 "terraform apply" is subsequently run.
/terraform/vars$
/terraform/vars$ terraform apply
 An execution plan has been generated and is shown below.
 Resource actions are indicated with the following symbols:
 create
 Terraform will perform the following actions:
 # local_file.test1 will be created
 resource "local_file" "test1" { content              = "hello test var"
 directory_permission = "0777"
 file_permission      = "0777"
 filename             = "/tmp/test-var.txt"
 id                   = (known after apply)
 }
 Plan: 1 to add, 0 to change, 0 to destroy.
 Do you want to perform these actions?
   Terraform will perform the actions described above.
   Only 'yes' will be accepted to approve.
 Enter a value: yes
 local_file.test1: Creating…
 local_file.test1: Creation complete after 0s [id=9f5d7ee95aa30648a2fb6f8e523e0547b7ecb78e]
 Apply complete! Resources: 1 added, 0 changed, 0 destroyed.
/terraform/vars$
/terraform/vars$
/terraform/vars$ cat /tmp/test-var.txt
 hello test var
Pass var values:
 1- if there is no values for var, when running "terrafom apply" it will ask for the values interactivily!
 2- cli params
    $ terraform apply -var "filename=/root/test.tst" -var "content=My Test"
 3- env vars  TF_VAR_xxx=xxx
    $ export TF_VAR_filename="/root/test.tst"
    $ terraform apply
 4- var files:
    autoloaded: terraform.tfvars, terraform.tfvars.json, *.auto.tfvars, *.auto.tvars.json
    explicit NAME.tfvars
    $ cat terraform.tfvars
      filename="/root/test.tst"
    $ terraform apply
    $ terraform -var-file NAME.tfvars

VAR PRECEDENCE: less -> more
 1 env vars
 2 terraform.tfvars
 3 *.auto.tfvars (alphabetic order)
 4 -var -r -var-file (cli flags)     --> highest priority!!!! it overrides all above options
This week I read that kubernetes is going to stop support for Docker soon. I was quite surprised. I am not an expert so it seems they have legit reasons. But I haven’t read anything from the other side. I think it is going to be painful so I need to try that in my lab and see how to do that migration. It has to be nice to learn that.
In the other end, I read a blog entry about ASICs from Cloudflare. I think without getting too technical it is a good one. And I learn about the different type of ASICs from Juniper. In the last years, I have only used devices powered by Broadcom ASICs. One day, I would like to try that P4/Barefoot Tofino devices. And related to this, I remember this NANOG presentation about ASICs that is really good (and fun!).
$ ls -ltr
-rw-r--r-- 1 tomas tomas 3612 Nov 15 16:36 Vagrantfile

$ vagrant status
Current machine states:
kubemaster not created (libvirt)
kubenode01 not created (libvirt)
kubenode02 not created (libvirt)

$ vagrant up
...
An unexpected error occurred when executing the action on the
'kubenode01' machine. Please report this as a bug:
cannot load such file -- erubis
...
3.1 Ok, we have to troubleshoot vagrant in my laptop. I googled a bit and couldnt find anything related. I remembered that you could install plugins with vagrant as once I had to update vagrant-libvirtd plugin. So this is kind of what I did.
$ vagrant version
Installed Version: 2.2.13
Latest Version: 2.2.13

$ vagrant plugin list
vagrant-libvirt (0.1.2, global)
Version Constraint: > 0

$ vagrant plugin update
Updating installed plugins…
Fetching fog-core-2.2.3.gem
Fetching nokogiri-1.10.10.gem
Building native extensions. This could take a while…
Building native extensions. This could take a while…
Fetching vagrant-libvirt-0.2.1.gem
Successfully uninstalled excon-0.75.0
Successfully uninstalled fog-core-2.2.0
Removing nokogiri
Successfully uninstalled nokogiri-1.10.9
Successfully uninstalled vagrant-libvirt-0.1.2
Updated 'vagrant-libvirt' to version '0.2.1'!

$ vagrant plugin install erubis

$ vagrant plugin update
Updating installed plugins…
Building native extensions. This could take a while…
Building native extensions. This could take a while…
Updated 'vagrant-libvirt' to version '0.2.1'!

$ vagrant plugin list
erubis (2.7.0, global)
Version Constraint: > 0
vagrant-libvirt (0.2.1, global)
Version Constraint: > 0
3.2. Now, I can start vagrant fine
$ vagrant up
....

$ vagrant status
Current machine states:
kubemaster running (libvirt)
kubenode01 running (libvirt)
kubenode02 running (libvirt)
4- Install kubeadm. I follow the official doc. It seems we have the pre-requisites. My laptop has 8GB RAM and 4 cpus. Our VMs are Ubuntu 16.04+.
5- Now we follow “Installing kubeadm, kubelet and kubectl” from main doc in each VM.
root@kubemaster:~#
root@kubemaster:~# sudo apt-get update && sudo apt-get install -y apt-transport-https curl
...
root@kubemaster:~# curl -s https://packages.cloud.google.com/apt/doc/apt-key.gpg | sudo apt-key add -
OK
root@kubemaster:~# cat <<EOF | sudo tee /etc/apt/sources.list.d/kubernetes.list
deb https://apt.kubernetes.io/ kubernetes-xenial main
EOF
deb https://apt.kubernetes.io/ kubernetes-xenial main
root@kubemaster:~# sudo apt-get update
...
root@kubemaster:~# sudo apt-get install -y kubelet kubeadm kubectl
...
root@kubemaster:~# ip -4 a
We dont have to do anything with the next section “Configure cgroup driver…” as we are using docker. So from the bottom of the main page, we click on the next section for using kubeadm and create a cluster.
6- So we have our three VMS with kubeadm. Now we are going to create a cluster. The kubemaster VM will be the control-plane node. So following “Initializing your control-plane node”, we dont need 1 (as we have only one control-node), for 2) will install weave-net as CNI in the next step, we need to use a new network for this: 10.244.0.0/16. 3) we dont need it and 4) we will specify the master ip. So, only on kubemaster:
root@kubemaster:~# kubeadm init --pod-network-cidr 10.244.0.0/16 --apiserver-advertise-address=192.168.56.2
W1115 17:13:31.213357 9958 configset.go:348] WARNING: kubeadm cannot validate component configs for API groups [kubelet.config.k8s.io kubeproxy.config.k8s.io]
[init] Using Kubernetes version: v1.19.4
[preflight] Running pre-flight checks
error execution phase preflight: [preflight] Some fatal errors occurred:
[ERROR Swap]: running with swap on is not supported. Please disable swap
[preflight] If you know what you are doing, you can make a check non-fatal with --ignore-preflight-errors=...
To see the stack trace of this error execute with --v=5 or higher
oh, problem. It seems we need to disable swap on the VMs. Actually, we will do in all VMs.
root@kubemaster:~# swapoff -a
Try again kubeadm init in master:
root@kubemaster:~# kubeadm init --pod-network-cidr 10.244.0.0/16 --apiserver-advertise-address=192.168.56.2
W1115 17:15:00.378279 10376 configset.go:348] WARNING: kubeadm cannot validate component configs for API groups [kubelet.config.k8s.io kubeproxy.config.k8s.io]
[init] Using Kubernetes version: v1.19.4
[preflight] Running pre-flight checks
[preflight] Pulling images required for setting up a Kubernetes cluster
[preflight] This might take a minute or two, depending on the speed of your internet connection
[preflight] You can also perform this action in beforehand using 'kubeadm config images pull'
[certs] Using certificateDir folder "/etc/kubernetes/pki"
[certs] Generating "ca" certificate and key
[certs] Generating "apiserver" certificate and key
[certs] apiserver serving cert is signed for DNS names [kubemaster kubernetes kubernetes.default kubernetes.default.svc kubernetes.default.svc.cluster.local] and IPs [10.96.0.1 192.168.56.2]
[certs] Generating "apiserver-kubelet-client" certificate and key
[certs] Generating "front-proxy-ca" certificate and key
[certs] Generating "front-proxy-client" certificate and key
[certs] Generating "etcd/ca" certificate and key
[certs] Generating "etcd/server" certificate and key
[certs] etcd/server serving cert is signed for DNS names [kubemaster localhost] and IPs [192.168.56.2 127.0.0.1 ::1]
[certs] Generating "etcd/peer" certificate and key
[certs] etcd/peer serving cert is signed for DNS names [kubemaster localhost] and IPs [192.168.56.2 127.0.0.1 ::1]
[certs] Generating "etcd/healthcheck-client" certificate and key
[certs] Generating "apiserver-etcd-client" certificate and key
[certs] Generating "sa" key and public key
[kubeconfig] Using kubeconfig folder "/etc/kubernetes"
[kubeconfig] Writing "admin.conf" kubeconfig file
[kubeconfig] Writing "kubelet.conf" kubeconfig file
[kubeconfig] Writing "controller-manager.conf" kubeconfig file
[kubeconfig] Writing "scheduler.conf" kubeconfig file
[kubelet-start] Writing kubelet environment file with flags to file "/var/lib/kubelet/kubeadm-flags.env"
[kubelet-start] Writing kubelet configuration to file "/var/lib/kubelet/config.yaml"
[kubelet-start] Starting the kubelet
[control-plane] Using manifest folder "/etc/kubernetes/manifests"
[control-plane] Creating static Pod manifest for "kube-apiserver"
[control-plane] Creating static Pod manifest for "kube-controller-manager"
[control-plane] Creating static Pod manifest for "kube-scheduler"
[etcd] Creating static Pod manifest for local etcd in "/etc/kubernetes/manifests"
[wait-control-plane] Waiting for the kubelet to boot up the control plane as static Pods from directory "/etc/kubernetes/manifests". This can take up to 4m0s
[apiclient] All control plane components are healthy after 25.543262 seconds
[upload-config] Storing the configuration used in ConfigMap "kubeadm-config" in the "kube-system" Namespace
[kubelet] Creating a ConfigMap "kubelet-config-1.19" in namespace kube-system with the configuration for the kubelets in the cluster
[upload-certs] Skipping phase. Please see --upload-certs
[mark-control-plane] Marking the node kubemaster as control-plane by adding the label "node-role.kubernetes.io/master=''"
[mark-control-plane] Marking the node kubemaster as control-plane by adding the taints [node-role.kubernetes.io/master:NoSchedule]
[bootstrap-token] Using token: aeseji.kovc0rjt6giakn1v
[bootstrap-token] Configuring bootstrap tokens, cluster-info ConfigMap, RBAC Roles
[bootstrap-token] configured RBAC rules to allow Node Bootstrap tokens to get nodes
[bootstrap-token] configured RBAC rules to allow Node Bootstrap tokens to post CSRs in order for nodes to get long term certificate credentials
[bootstrap-token] configured RBAC rules to allow the csrapprover controller automatically approve CSRs from a Node Bootstrap Token
[bootstrap-token] configured RBAC rules to allow certificate rotation for all node client certificates in the cluster
[bootstrap-token] Creating the "cluster-info" ConfigMap in the "kube-public" namespace
[kubelet-finalize] Updating "/etc/kubernetes/kubelet.conf" to point to a rotatable kubelet client certificate and key
[addons] Applied essential addon: CoreDNS
[addons] Applied essential addon: kube-proxy
Your Kubernetes control-plane has initialized successfully!
To start using your cluster, you need to run the following as a regular user:
mkdir -p $HOME/.kube
sudo cp -i /etc/kubernetes/admin.conf $HOME/.kube/config
sudo chown $(id -u):$(id -g) $HOME/.kube/config
You should now deploy a pod network to the cluster.
Run "kubectl apply -f [podnetwork].yaml" with one of the options listed at:
https://kubernetes.io/docs/concepts/cluster-administration/addons/
Then you can join any number of worker nodes by running the following on each as root:
kubeadm join 192.168.56.2:6443 --token aeseji.kovc0rjt6giakn1v \
--discovery-token-ca-cert-hash sha256:c1b91ec9cebe065665c314bfe9a7ce9c0ef970d56ae762dae5ce308caacbd8cd
root@kubemaster:~#
7- We need to follow the output of kubeadm init in kubemaster. As well pay attention as the info for joining our worker-nodes to the cluster in there too (“kubeadm join ….”)
We can test the status of the control-node. It is NotReady because it needs the network configuration.
vagrant@kubemaster:~$ kubectl get nodes
NAME STATUS ROLES AGE VERSION
kubemaster NotReady master 2m9s v1.19.4
8- From the same page, now we need to follow “Installing a Pod network add-on”. I dont know why but the documentation is not great about it. You need to dig in all version to find the steps to install wave-net. This is the link. So we install wave-net only on the kubemaster:
vagrant@kubemaster:~$ kubectl apply -f "https://cloud.weave.works/k8s/net?k8s-version=$(kubectl version | base64 | tr -d '\n')"
serviceaccount/weave-net created
clusterrole.rbac.authorization.k8s.io/weave-net created
clusterrolebinding.rbac.authorization.k8s.io/weave-net created
role.rbac.authorization.k8s.io/weave-net created
rolebinding.rbac.authorization.k8s.io/weave-net created
daemonset.apps/weave-net created
vagrant@kubemaster:~$
vagrant@kubemaster:~$ kubectl get nodes
NAME STATUS ROLES AGE VERSION
kubemaster Ready master 4m32s v1.19.4
9- We can follow to the section “Joining your nodes”. We need to apply the “kubeadm join…” command from the outout of “kubeadm init” in master node in only the worker-nodes.
root@kubenode02:~# kubeadm join 192.168.56.2:6443 --token aeseji.kovc0rjt6giakn1v --discovery-token-ca-cert-hash sha256:c1b91ec9cebe065665c314bfe9a7ce9c0ef970d56ae762dae5ce308caacbd8cd
[preflight] Running pre-flight checks
[preflight] Reading configuration from the cluster…
[preflight] FYI: You can look at this config file with 'kubectl -n kube-system get cm kubeadm-config -oyaml'
[kubelet-start] Writing kubelet configuration to file "/var/lib/kubelet/config.yaml"
[kubelet-start] Writing kubelet environment file with flags to file "/var/lib/kubelet/kubeadm-flags.env"
[kubelet-start] Starting the kubelet
[kubelet-start] Waiting for the kubelet to perform the TLS Bootstrap…
This node has joined the cluster:
Certificate signing request was sent to apiserver and a response was received.
The Kubelet was informed of the new secure connection details.
Run 'kubectl get nodes' on the control-plane to see this node join the cluster.
root@kubenode02:~#
10- We need to wait a bit, but finally the worker nodes will come up as Ready if we check in the master/control-node:
vagrant@kubemaster:~$ kubectl get nodes
NAME STATUS ROLES AGE VERSION
kubemaster Ready master 6m35s v1.19.4
kubenode01 Ready 2m13s v1.19.4
kubenode02 Ready 2m10s v1.19.4
vagrant@kubemaster:~$
11- Let’s verify we have a working cluster just creating a pod.
vagrant@kubemaster:~$ kubectl run ngix --image=nginx
pod/ngix created

vagrant@kubemaster:~$ kubectl get pod
NAME READY STATUS RESTARTS AGE
ngix 0/1 ContainerCreating 0 5s
vagrant@kubemaster:~$
vagrant@kubemaster:~$ kubectl get pod
NAME READY STATUS RESTARTS AGE
ngix 1/1 Running 0 83s
vagrant@kubemaster:~$

vagrant@kubemaster:~$ kubectl delete pod ngix
pod "ngix" deleted

vagrant@kubemaster:~$ kubectl get pod -n kube-system
NAME READY STATUS RESTARTS AGE
coredns-f9fd979d6-b9b92 1/1 Running 0 10m
coredns-f9fd979d6-t822r 1/1 Running 0 10m
etcd-kubemaster 1/1 Running 0 10m
kube-apiserver-kubemaster 1/1 Running 0 10m
kube-controller-manager-kubemaster 1/1 Running 2 10m
kube-proxy-jpb9p 1/1 Running 0 10m
kube-proxy-lkpv9 1/1 Running 0 6m13s
kube-proxy-sqd9v 1/1 Running 0 6m10s
kube-scheduler-kubemaster 1/1 Running 2 10m
weave-net-8rl49 2/2 Running 0 6m13s
weave-net-fkqdv 2/2 Running 0 6m10s
weave-net-q79pb 2/2 Running 0 7m48s
vagrant@kubemaster:~$
So, we have a working kubernetes cluster built with kubeadm using vagrant/libvirtd!
As a note, while building the VMs and installing software on them, my laptop hang a couple of times as the 3VMS running at the same time takes nearly all RAM. But this is a good exercise to understand the requirements of kubeadm to build a cluster and as well, it is a lab env you can use while studying if the cloud env are down or you dont have internet. Let’s see If I manage to pass the CKA one day!!!
3VMs running
----
# top
top - 17:24:10 up 9 days, 18:18, 1 user, load average: 5.22, 5.09, 4.79
Tasks: 390 total, 1 running, 388 sleeping, 0 stopped, 1 zombie
%Cpu(s): 21.7 us, 19.5 sy, 0.0 ni, 56.5 id, 2.0 wa, 0.0 hi, 0.2 si, 0.0 st
MiB Mem : 7867.7 total, 263.0 free, 6798.7 used, 806.0 buff/cache
MiB Swap: 6964.0 total, 991.4 free, 5972.6 used. 409.6 avail Mem
PID USER PR NI VIRT RES SHR S %CPU %MEM TIME+ COMMAND
329875 tomas 20 0 9268464 251068 83584 S 55.8 3.1 14:27.84 chrome
187962 tomas 20 0 1302500 105228 46528 S 36.9 1.3 170:58.40 chrome
331127 libvirt+ 20 0 4753296 1.3g 5972 S 35.5 17.5 7:13.00 qemu-system-x86
330979 libvirt+ 20 0 4551524 954212 5560 S 7.3 11.8 4:08.33 qemu-system-x86
5518 root 20 0 1884932 135616 8528 S 5.3 1.7 76:50.45 Xorg
330803 libvirt+ 20 0 4550504 905428 5584 S 5.3 11.2 4:12.68 qemu-system-x86
6070 tomas 9 -11 1180660 6844 4964 S 3.7 0.1 44:04.39 pulseaudio
333253 tomas 20 0 4708156 51400 15084 S 3.3 0.6 1:23.72 chrome
288344 tomas 20 0 2644572 56560 14968 S 1.7 0.7 9:03.78 Web Content
6227 tomas 20 0 139916 8316 4932 S 1.3 0.1 19:59.68 gkrellm

3VMS stopped
----
root@athens:/home/tomas# top
top - 18:40:09 up 9 days, 19:34, 1 user, load average: 0.56, 1.09, 1.30
Tasks: 379 total, 2 running, 376 sleeping, 0 stopped, 1 zombie
%Cpu(s): 4.5 us, 1.5 sy, 0.0 ni, 94.0 id, 0.0 wa, 0.0 hi, 0.0 si, 0.0 st
MiB Mem : 7867.7 total, 3860.9 free, 3072.9 used, 933.9 buff/cache
MiB Swap: 6964.0 total, 4877.1 free, 2086.9 used. 4122.1 avail Mem
PID USER PR NI VIRT RES SHR S %CPU %MEM TIME+ COMMAND
288344 tomas 20 0 2644572 97532 17100 S 6.2 1.2 11:05.35 Web Content
404910 root 20 0 12352 5016 4040 R 6.2 0.1 0:00.01 top
1 root 20 0 253060 7868 5512 S 0.0 0.1 0:47.82 systemd
2 root 20 0 0 0 0 S 0.0 0.0 0:02.99 kthreadd
3 root 0 -20 0 0 0 I 0.0 0.0 0:00.00 rcu_gp
4 root 0 -20 0 0 0 I 0.0 0.0 0:00.00 rcu_par_gp
6 root 0 -20 0 0 0 I 0.0 0.0 0:00.00 kworker/0:0H
9 root 0 -20 0 0 0 I 0.0 0.0 0:00.00 mm_percpu_wq
10 root 20 0 0 0 0 S 0.0 0.0 0:11.39 ksoftirqd/0
11 root 20 0 0 0 0 I 0.0 0.0 2:13.55 rcu_sched
root@athens:/home/tomas#
I get mad whenever I hear “work hard” lately. What the f* that means? Do I need to stay in my desk for 16 hours every day? This is what I understand for working hard. I am subscribed to the SDN mail list of IPSpace and this week the email was about this topic and related to network automation. My former CTO told me one day “work smarter, not harder”. I am not very smart, but I try. And one key thing, it is focus.
I was already playing with gNMI and protobuf a couple of months ago. But this week I received a summary from the last NANOG80 meeting and there was a presentation about it. Great job from Colin!
So I decided to give it a go as the demo was based on docker and I have already my Arista lab in cEOS and vEOS as targets.
Ok, the container is created and seems running but the gnmi-gateway can’t connect to my cEOS r01….
First thing, I had to check iptables. It is not the first time that when playing with docker and building different environments (vEOS vs gnmi-gateway) with different docker commands, iptables may be not configured properly.
And it was the case again:
# iptables -t filter -S DOCKER-ISOLATION-STAGE-1
Warning: iptables-legacy tables present, use iptables-legacy to see them
-N DOCKER-ISOLATION-STAGE-1
-A DOCKER-ISOLATION-STAGE-1 -i br-43481af25965 ! -o br-43481af25965 -j DOCKER-ISOLATION-STAGE-2
-A DOCKER-ISOLATION-STAGE-1 -j ACCEPT
-A DOCKER-ISOLATION-STAGE-1 -i docker0 ! -o docker0 -j DOCKER-ISOLATION-STAGE-2
-A DOCKER-ISOLATION-STAGE-1 -i br-94c1e813ad6f ! -o br-94c1e813ad6f -j DOCKER-ISOLATION-STAGE-2
-A DOCKER-ISOLATION-STAGE-1 -i br-4bd17cfa19a8 ! -o br-4bd17cfa19a8 -j DOCKER-ISOLATION-STAGE-2
-A DOCKER-ISOLATION-STAGE-1 -i br-13ab2b6a0d1d ! -o br-13ab2b6a0d1d -j DOCKER-ISOLATION-STAGE-2
-A DOCKER-ISOLATION-STAGE-1 -i br-121978ca0282 ! -o br-121978ca0282 -j DOCKER-ISOLATION-STAGE-2
-A DOCKER-ISOLATION-STAGE-1 -i br-00db5844bbb0 ! -o br-00db5844bbb0 -j DOCKER-ISOLATION-STAGE-2
-A DOCKER-ISOLATION-STAGE-1 -j RETURN
So I moved the new docker bridge network for gnmi-gateway after “ACCEPT” and solved.
# iptables -t filter -D DOCKER-ISOLATION-STAGE-1 -j ACCEPT
# iptables -t filter -I DOCKER-ISOLATION-STAGE-1 -j ACCEPT
#
# iptables -t filter -S DOCKER-ISOLATION-STAGE-1
Warning: iptables-legacy tables present, use iptables-legacy to see them
-N DOCKER-ISOLATION-STAGE-1
-A DOCKER-ISOLATION-STAGE-1 -j ACCEPT
-A DOCKER-ISOLATION-STAGE-1 -i br-43481af25965 ! -o br-43481af25965 -j DOCKER-ISOLATION-STAGE-2
-A DOCKER-ISOLATION-STAGE-1 -i docker0 ! -o docker0 -j DOCKER-ISOLATION-STAGE-2
-A DOCKER-ISOLATION-STAGE-1 -i br-94c1e813ad6f ! -o br-94c1e813ad6f -j DOCKER-ISOLATION-STAGE-2
-A DOCKER-ISOLATION-STAGE-1 -i br-4bd17cfa19a8 ! -o br-4bd17cfa19a8 -j DOCKER-ISOLATION-STAGE-2
-A DOCKER-ISOLATION-STAGE-1 -i br-13ab2b6a0d1d ! -o br-13ab2b6a0d1d -j DOCKER-ISOLATION-STAGE-2
-A DOCKER-ISOLATION-STAGE-1 -i br-121978ca0282 ! -o br-121978ca0282 -j DOCKER-ISOLATION-STAGE-2
-A DOCKER-ISOLATION-STAGE-1 -i br-00db5844bbb0 ! -o br-00db5844bbb0 -j DOCKER-ISOLATION-STAGE-2
-A DOCKER-ISOLATION-STAGE-1 -j RETURN
#
So, restarted gnmi-gateway, still same issue. Ok, I decided to check if the packets were actually hitting r01.
So at first sight, the tcp handshake is established but then there is TCP RST….
So I double checked that gnmi was runnig in my side:
r1#show management api gnmi
Enabled:            Yes
Server:             running on port 3333, in MGMT VRF
SSL Profile:        none
QoS DSCP:           none
r1#
At that moment, I thought that was an issue in cEOS… checking logs I couldnt see any confirmation but I decided to give it a go with vEOS that is more feature rich. So I turned up my GCP lab and followed the same steps with gnmi-gateway. I updated the targets.json with the details of one of my vEOS devices. And run again:
~/gnmi/gnmi-gateway release$ sudo docker run -it --rm -p 59100:59100 -v $(pwd)/examples/gnmi-prometheus/targets.json:/opt/gnmi-gateway/targets.json --name gnmi-gateway-01 --network gnmi-net gnmi-gateway:latest
{"level":"info","time":"2020-11-07T19:22:20Z","message":"Starting GNMI Gateway."}
{"level":"info","time":"2020-11-07T19:22:20Z","message":"Clustering is NOT enabled. No locking or cluster coordination will happen."}
{"level":"info","time":"2020-11-07T19:22:20Z","message":"Starting connection manager."}
{"level":"info","time":"2020-11-07T19:22:20Z","message":"Starting gNMI server on 0.0.0.0:9339."}
{"level":"info","time":"2020-11-07T19:22:20Z","message":"Starting Prometheus exporter."}
{"level":"info","time":"2020-11-07T19:22:20Z","message":"Connection manager received a target control message: 1 inserts 0 removes"}
{"level":"info","time":"2020-11-07T19:22:20Z","message":"Initializing target gcp-r1 ([192.168.249.4:3333]) map[NoTLS:yes]."}
{"level":"info","time":"2020-11-07T19:22:20Z","message":"Target gcp-r1: Connecting"}
{"level":"info","time":"2020-11-07T19:22:20Z","message":"Target gcp-r1: Subscribing"}
{"level":"info","time":"2020-11-07T19:22:20Z","message":"Starting Prometheus HTTP server."}
{"level":"info","time":"2020-11-07T19:22:30Z","message":"Target gcp-r1: Disconnected"}
E1107 19:22:30.048410 1 reconnect.go:114] client.Subscribe (target "gcp-r1") failed: client "gnmi" : client "gnmi" : Dialer(192.168.249.4:3333, 10s): context deadline exceeded; reconnecting in 552.330144ms
{"level":"info","time":"2020-11-07T19:22:40Z","message":"Target gcp-r1: Disconnected"}
E1107 19:22:40.603141 1 reconnect.go:114] client.Subscribe (target "gcp-r1") failed: client "gnmi" : client "gnmi" : Dialer(192.168.249.4:3333, 10s): context deadline exceeded; reconnecting in 1.080381816s
Again, same issue. Let’s see from vEOS perspective.
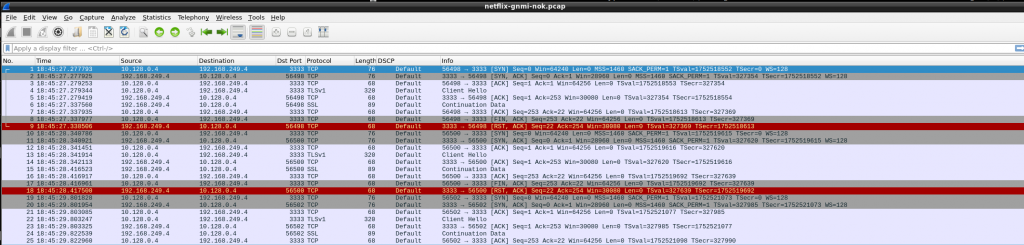
So again in GCP, tcp is established but then TCP RST. As vEOS is my last resort, I tried to dig into that TCP connection. I downloaded a pcap to analyze with wireshark so get a better visual clue…
So, somehow, gnmi-gateway is trying to negotiate TLS!!! As per my understanding, my targets.json was configured with “NoTLS”: “yes” so that should be avoid, shouldn’t be?
At that moment, I wanted to know how to identfiy TLS/SSL packets using tcpdump as it is not always that easy to get quickly a pcap in wireshark. So I found the answer here:
bash-4.2# tcpdump -i any "tcp port 3333 and (tcp[((tcp[12] & 0xf0) >> 2)] = 0x16)"
tcpdump: verbose output suppressed, use -v or -vv for full protocol decode
listening on any, link-type LINUX_SLL (Linux cooked v1), capture size 262144 bytes
19:47:01.367197 In 1e:3d:5b:13:d8:fe (oui Unknown) ethertype IPv4 (0x0800), length 320: 10.128.0.4.50486 > 192.168.249.4.dec-notes: Flags [P.], seq 2715923852:2715924104, ack 2576249027, win 511, options [nop,nop,TS val 1194424180 ecr 1250876], length 252
19:47:02.405870 In 1e:3d:5b:13:d8:fe (oui Unknown) ethertype IPv4 (0x0800), length 320: 10.128.0.4.50488 > 192.168.249.4.dec-notes: Flags [P.], seq 680803294:680803546, ack 3839769659, win 511, options [nop,nop,TS val 1194425218 ecr 1251136], length 252
19:47:04.139458 In 1e:3d:5b:13:d8:fe (oui Unknown) ethertype IPv4 (0x0800), length 320: 10.128.0.4.50490 > 192.168.249.4.dec-notes: Flags [P.], seq 3963338234:3963338486, ack 1760248652, win 511, options [nop,nop,TS val 1194426952 ecr 1251569], length 252
Not something easy to remember 🙁
Ok, I wanted to be sure that gnmi was functional in vEOS and by a quick internet look up, I found this project gnmic! Great job by the author!
So I configured the tool and tested with my vEOS. And worked (without needing TLS)
So, I kind of I was sure that my issue was configuring gnmi-gateway. I tried to troubleshoot it: removed the NoTLS, using the debugging mode, build the code, read the Go code for Target (too complex for my Goland knowledge 🙁 )
So at the end, I gave up and opened an issue with gnmi-gateway author. And he answered super quick with the solution!!! I misunderstood the meaning of “NoTLS” 🙁
So I followed his instructions to configure TLS in my gnmi cEOS config
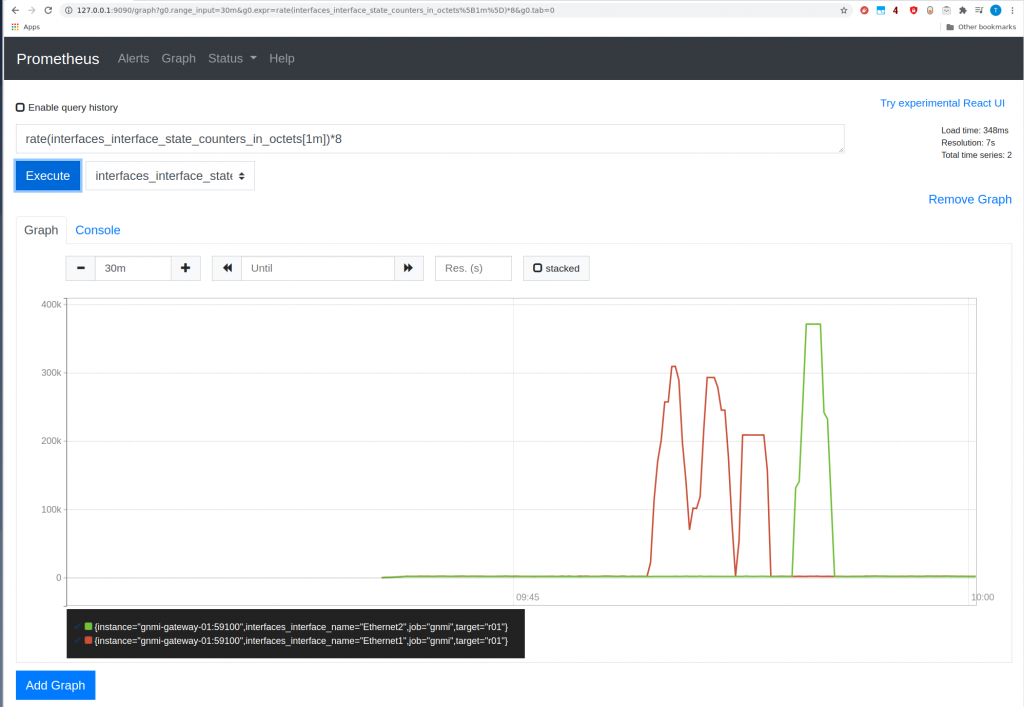
Now we can open prometheus UI and verify if we are consuming data from cEOS r01.
Yeah! it is there.
So all working at then. It has a nice experience. At the end of the day, I want to know more about gNMI/protobuffer, etc. The cold thing here is you can get telemetry and configuration management of your devices. So using gnmi-gateway (that is more for a high availability env like Netflix) and gnmic are great tools to get your head around.
3- Check help for all restore options. Keep in mind you will need (very likely) to provide certs for auth.
$ ETCDTL_API=3 etcdctl snapshot restore -h
4- Restore ETCD using a previous backup:
$ ETCDTL_API=3 etcdctl --endpoints 127.0.0.1:2379 snapshot restore FILE \
--cacert xxx --cert xx --key xxx
--data-dir /NEW/DIR \--initial-cluster-toker TOKEN \ (token is any word) --name master \ --initial-cluster=master=https://127.0.0.1:2380 \ --initial-advertise-peer-urls=https://127.0.0.1:2380 USE HTTPS!!!!
5- Add new lines and update volume paths in ETCD config. If it is a static pod, check in /etc/kubernetes/manifests in master node.
--data-dir=/NEW/DIR
--initial-cluster-token TOKEN

++ volumeMounts/volumes to new path /NEW/DIR !!!!
6- Restart services if not running kubeadm
$ systemctl daemon-reload
$ service etcd restart
$ service etcd kube-apiserver start
7- Checks
/// if using kubeadm, docker instance for etcd should restart
$ docker ps -a | grep -i etcd

/// check etcd is running showing members:
$ ETCDCTL_API=3 etcdctl member list --cacert xxx --cert xx --key xxx
Sidecar -logging
Based on this doc. You want to send some logs to stderr so you create a new container that takes those.
If you want to use “kubectl top” you need to install “metrics-server”
$ kubectl top pod --all-namespaces
Keep in mind that “kubectl top” shows metrics for a given pod. That information is based on reports from cAdvisor, which collects real pods resource usage.
And as per link3, “kubectl top” is not the same as running “top” inside the container.