I am subscribed to this site to get news about SSL/TLS. I am not great at security so want to try to read things like this.
This week there was an article about GFC blocking encrypted SNI. Obviously I had to read about what was ESNI via the Cloudflare link.
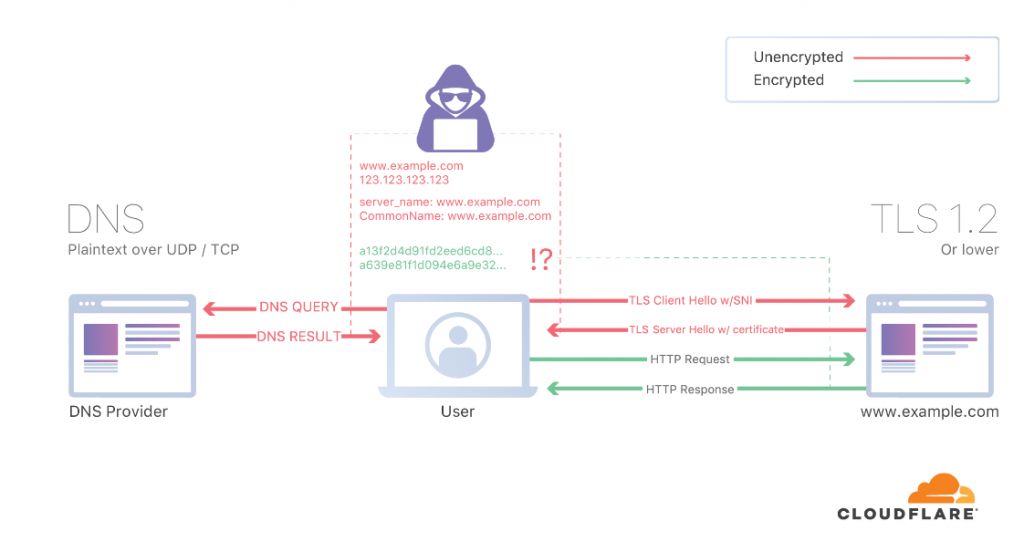
From that article, I recognized the SANs from certificates (if you have to renew a certificate with SANs is more expensive, that’s how I learned it). They consider it a hack, not 100% sure why. I thought having encrypted DNS should be enough but I forgot that when you negotiate TLS, that is not encrypted so the SNI you are sending is seen. The picture below, clarified it to me:
So for more details about ESNI, I had to read another entry. So you need TLS 1.3, DNSSEC and DoT/DoH to get the whole thing working. And not everybody support eSNI (rfc3546). As far as I can see, my GC browser doesnt support it and only FF does.
So if I want to get this working in my end I need to encrypt my DNS and use FF. Somehow, I have to be playing with this before because I noticed I had already installed stubby for configuring DNS over TLS. But it wasn’t in use as my resolv.conf is updated every time my laptop wakes up. So I have to change it manually:
cat /etc/resolv.conf
# Generated by NetworkManager
# Check stubby is running
# $ sudo netstat -lnptu | grep stubby
# you can test having wireshark and check tcp 853 to 1.1.1.1 and not seeing # any udp 53.
# dig @127.0.0.0 www.google.com
search mynet
nameserver 127.0.0.1

# netstat -lnptu | grep stubby
tcp 0 0 127.0.0.1:53 0.0.0.0:* LISTEN 478658/stubby
tcp6 0 0 ::1:53 :::* LISTEN 478658/stubby
udp 0 0 127.0.0.1:53 0.0.0.0:* 478658/stubby
udp6 0 0 ::1:53 :::* 478658/stubby
After that change, I tried to test it but I couldnt see any traffic on tcp 853. The stubby service was running but something wasn’t ok.
Aug 31 17:34:44 athens stubby[11294]: Could not schedule query: None of the configured upstreams could be used to send queries on the spe>
Aug 31 17:34:44 athens stubby[11294]: Could not schedule query: None of the configured upstreams could be used to send queries on the spe>
Aug 31 17:34:44 athens stubby[11294]: Could not schedule query: None of the configured upstreams could be used to send queries on the spe>
Aug 31 17:34:44 athens stubby[11294]: Could not schedule query: None of the configured upstreams could be used to send queries on the spe>
So I decided to check the config. My config is the default one so it is using some specific servers. I enabled Google and Cloudflare resolvers and restart stubby. After that, we have tcp 853!
What it looks very clear, it is very verbose. I have “suspender” enabled in GC so there are not may tabs in the background doing things… In my former employer. The firewalls stats showed that DNS was the protocol most used in our corporate network…
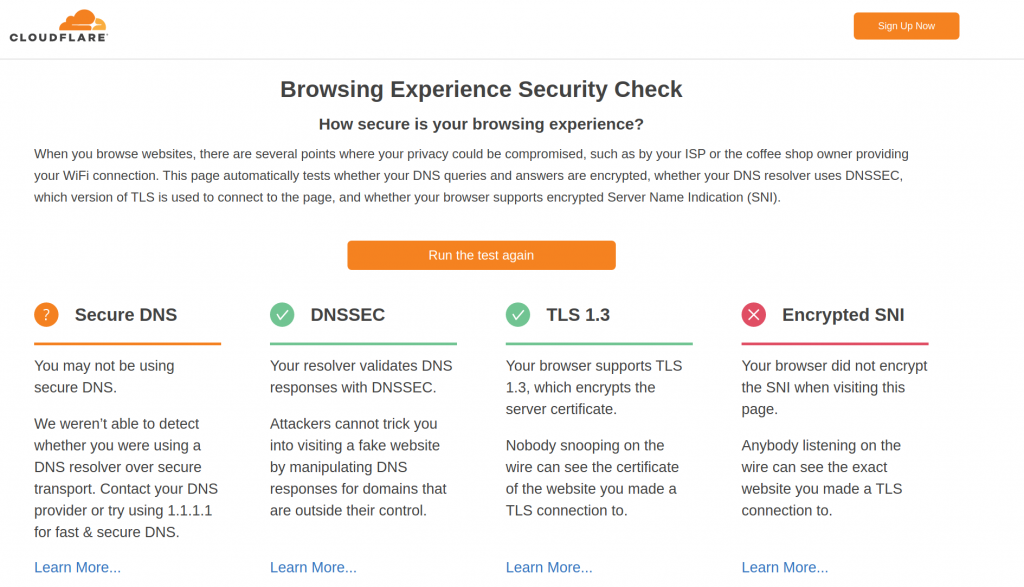
So once I have DNSSEC enabled, let’s run the eSNI test.
This is from GC:
So good thing DNSSEC and TLS1.3 are fine. Expected that eSNI is failing.
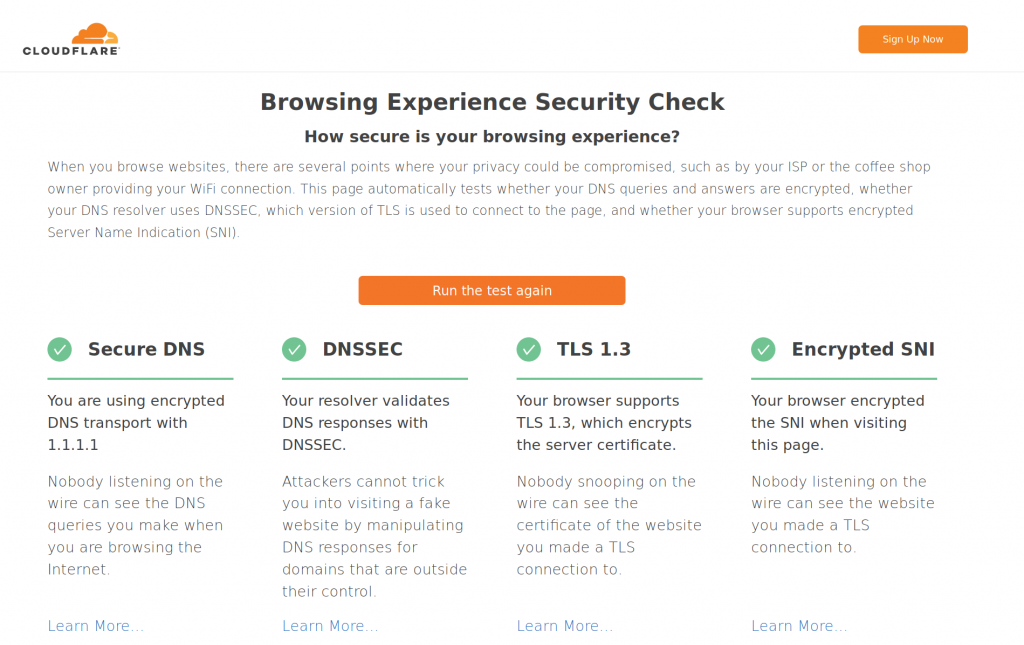
For FF, eSNI is not enabled by default, and took me a bit to find a blog that showed the correct steps to configure it. This is the winner. I need two changes in my about.config and restart FF. And this is the result for the same test page:
So it is nice to have the whole setup working with FF. It would be great if GC had eSNI support. But still this has to be supported by the destination web server.
Yesterday read for first time an article about zswap. I though it was something new, but a bit search showed that it started around 2013 as per this article.
I have a 2015 Dell XPS13 with i7, 128GB SSD and 8GB RAM. But some times my systems struggle with memory and when swapping kicks in, the system gets stuck. I have used swappiness in the past but not much improvement (or it was in my former company laptop??). Anyway this is my current swappiness:
Ok, check you have ZSWAP available in your kernel.
$ uname -a
Linux x 5.7.0-2-amd64 #1 SMP Debian 5.7.10-1 (2020-07-26) x86_64 GNU/Linux

$ cat /boot/config-uname -r | grep -i zswap
CONFIG_ZSWAP=y
# CONFIG_ZSWAP_COMPRESSOR_DEFAULT_DEFLATE is not set
CONFIG_ZSWAP_COMPRESSOR_DEFAULT_LZO=y
# CONFIG_ZSWAP_COMPRESSOR_DEFAULT_842 is not set
# CONFIG_ZSWAP_COMPRESSOR_DEFAULT_LZ4 is not set
# CONFIG_ZSWAP_COMPRESSOR_DEFAULT_LZ4HC is not set
# CONFIG_ZSWAP_COMPRESSOR_DEFAULT_ZSTD is not set
CONFIG_ZSWAP_COMPRESSOR_DEFAULT="lzo"
CONFIG_ZSWAP_ZPOOL_DEFAULT_ZBUD=y
# CONFIG_ZSWAP_ZPOOL_DEFAULT_Z3FOLD is not set
# CONFIG_ZSWAP_ZPOOL_DEFAULT_ZSMALLOC is not set
CONFIG_ZSWAP_ZPOOL_DEFAULT="zbud"
# CONFIG_ZSWAP_DEFAULT_ON is not set

$ cat /sys/module/zswap/parameters/enabled
N
If you have “N”in the last command and “CONFIG_ZSWAP=y” then your systems supports zswap but it is not enabled.
$ echo Y | sudo tee /sys/module/zswap/parameters/enabled

$ cat /sys/module/zswap/parameters/enabled
Y
Now you can tune some parameters to increase compression rate (3:1)
# list all parameters
grep . /sys/module/zswap/parameters/*

# change  compression params
echo z3fold | sudo tee /sys/module/zswap/parameters/zpool
echo lzo | sudo tee /sys/module/zswap/parameters/compressor
How to check zswap is working? I followed this email thread to find some clues:
One day when I was a child, I recollect an interview (TV or radio not sure) about a basketball player who have been playing for a long time without an injury. And that was reported as something extraordinary. I think the interview said the moto of this player was “My body and mind are a temple so I look after them very well”. I can’t say who was the player, if it was NBA or something else. I dont think it was a famous player neither. Or maybe this is something that my mind made up from something. Not sure, but that sentence has been with me since them although it has taken years to fully understand. For many years, I have been trying to look after myself (body and mind) as best as I can. And there is always way to improve and things not to forget.
For that reason I read this book. I have already read Ross’ first book back in 2018, so the new one was appealing .
One of the central subjects of his adventure is taking stoicism as a philosophy base. And that is something I feel quite close lately.
Apart from the philosophy, there are many points important for succeeding in such a challenge (without being sick!)
preparation: getting wintered
control your pace
strength training / stress
manage pain
manage fear
humor
importance of food (hunger)
importance of digestion
sleep
your pyramid of needs (Maslow’s)
As the author says, there is no superpower or birth gift. It is just you and the cocktel above to achieve whatever you want.
Just finished this book. I heard about it from my goland training… and actually it is quite good. You see the extrapolation of negotiation techniques from a FBI negotiator to the business world. One the first things I noticed is how he highlights the importance our the lack of rationality based on “Thinking, fast and slow” when making decisions.
I dont consider myself a good negotiator or bargainer but you can always learn something new like about how to negotiate a pay rise 🙂
It is interesting the focus in:
Mirroring the other side: create rapport
Labelling: create trust reusing words. Proof you are listening.
Look for the “No“: This is quite unusual as you are always pushed for the “yes”. The “No” provides a lot info for getting to the real deal.
Use “How”, “What”. Avoid “Why”.
Body language is very important and how you say things. Keep feelings at bay. Remember the night show’s DJ voice. Be ready to take a punch.
Create the illusion of control in the other side
Find the lair/time-waster. Ensure the next steps.
Ackerman Bargaining: start at 65% of your target price. Increase to 85%, 95% and 100%. Use empathy and different ways to say “no”. Use precise, nonround numbers for the final offer.
Not all is about the money. You can use non monetary items to get the deal (free publicity, etc)
Find Unknown Unknows (aka the black swan)
As the author says, it is better “no deal” than a “bad deal”.
I hope I can remember things for the next time I am in negotiation situation.
I rebooted my laptop today and realised that docker wasnt running… It was running before the reboot and I didn’t upgrade anything related to docker (or I thought)
$ docker ps -a
Cannot connect to the Docker daemon at unix:///var/run/docker.sock. Is the docker daemon running?
$
Let’s check status and start if needed:
root@athens:/var/log# service docker status
● docker.service - Docker Application Container Engine
Loaded: loaded (/lib/systemd/system/docker.service; enabled; vendor preset: enabled)
Active: failed (Result: exit-code) since Fri 2020-08-21 08:34:03 BST; 7min ago
TriggeredBy: ● docker.socket
Docs: https://docs.docker.com
Main PID: 12015 (code=exited, status=1/FAILURE)
Aug 21 08:34:03 athens systemd[1]: docker.service: Scheduled restart job, restart counter is at 3.
Aug 21 08:34:03 athens systemd[1]: Stopped Docker Application Container Engine.
Aug 21 08:34:03 athens systemd[1]: docker.service: Start request repeated too quickly.
Aug 21 08:34:03 athens systemd[1]: docker.service: Failed with result 'exit-code'.
Aug 21 08:34:03 athens systemd[1]: Failed to start Docker Application Container Engine.
Aug 21 08:34:42 athens systemd[1]: docker.service: Start request repeated too quickly.
Aug 21 08:34:42 athens systemd[1]: docker.service: Failed with result 'exit-code'.
Aug 21 08:34:42 athens systemd[1]: Failed to start Docker Application Container Engine.
root@athens:/var/log#
root@athens:/var/log#
root@athens:/var/log# service docker start
Job for docker.service failed because the control process exited with error code.
See "systemctl status docker.service" and "journalctl -xe" for details.
root@athens:/var/log# systemctl status docker.service
● docker.service - Docker Application Container Engine
Loaded: loaded (/lib/systemd/system/docker.service; enabled; vendor preset: enabled)
Active: failed (Result: exit-code) since Fri 2020-08-21 08:41:20 BST; 5s ago
TriggeredBy: ● docker.socket
Docs: https://docs.docker.com
Process: 35305 ExecStart=/usr/sbin/dockerd -H fd:// $DOCKER_OPTS (code=exited, status=1/FAILURE)
Main PID: 35305 (code=exited, status=1/FAILURE)
Aug 21 08:41:19 athens systemd[1]: docker.service: Main process exited, code=exited, status=1/FAILURE
Aug 21 08:41:19 athens systemd[1]: docker.service: Failed with result 'exit-code'.
Aug 21 08:41:19 athens systemd[1]: Failed to start Docker Application Container Engine.
Aug 21 08:41:20 athens systemd[1]: docker.service: Scheduled restart job, restart counter is at 3.
Aug 21 08:41:20 athens systemd[1]: Stopped Docker Application Container Engine.
Aug 21 08:41:20 athens systemd[1]: docker.service: Start request repeated too quickly.
Aug 21 08:41:20 athens systemd[1]: docker.service: Failed with result 'exit-code'.
Aug 21 08:41:20 athens systemd[1]: Failed to start Docker Application Container Engine.
root@athens:/var/log#
Ok, so not much info… let check the recommend details:
root@athens:/var/log# journalctl -xe
░░ Support: https://www.debian.org/support
░░
░░ A start job for unit docker.socket has begun execution.
░░
░░ The job identifier is 4236.
Aug 21 08:41:20 athens systemd[1]: Listening on Docker Socket for the API.
░░ Subject: A start job for unit docker.socket has finished successfully
░░ Defined-By: systemd
░░ Support: https://www.debian.org/support
░░
░░ A start job for unit docker.socket has finished successfully.
░░
░░ The job identifier is 4236.
Aug 21 08:41:20 athens systemd[1]: docker.service: Start request repeated too quickly.
Aug 21 08:41:20 athens systemd[1]: docker.service: Failed with result 'exit-code'.
░░ Subject: Unit failed
░░ Defined-By: systemd
░░ Support: https://www.debian.org/support
░░
░░ The unit docker.service has entered the 'failed' state with result 'exit-code'.
Aug 21 08:41:20 athens systemd[1]: Failed to start Docker Application Container Engine.
░░ Subject: A start job for unit docker.service has failed
░░ Defined-By: systemd
░░ Support: https://www.debian.org/support
░░
░░ A start job for unit docker.service has finished with a failure.
░░
░░ The job identifier is 4113 and the job result is failed.
Aug 21 08:41:20 athens systemd[1]: docker.socket: Failed with result 'service-start-limit-hit'.
░░ Subject: Unit failed
░░ Defined-By: systemd
░░ Support: https://www.debian.org/support
░░
░░ The unit docker.socket has entered the 'failed' state with result 'service-start-limit-hit'.
root@athens:/var/log# systemctl status docker.service log
Unit log.service could not be found.
● docker.service - Docker Application Container Engine
Loaded: loaded (/lib/systemd/system/docker.service; enabled; vendor preset: enabled)
Active: failed (Result: exit-code) since Fri 2020-08-21 08:41:20 BST; 1min 2s ago
TriggeredBy: ● docker.socket
Docs: https://docs.docker.com
Process: 35305 ExecStart=/usr/sbin/dockerd -H fd:// $DOCKER_OPTS (code=exited, status=1/FAILURE)
Main PID: 35305 (code=exited, status=1/FAILURE)
Aug 21 08:41:19 athens systemd[1]: docker.service: Main process exited, code=exited, status=1/FAILURE
Aug 21 08:41:19 athens systemd[1]: docker.service: Failed with result 'exit-code'.
Aug 21 08:41:19 athens systemd[1]: Failed to start Docker Application Container Engine.
Aug 21 08:41:20 athens systemd[1]: docker.service: Scheduled restart job, restart counter is at 3.
Aug 21 08:41:20 athens systemd[1]: Stopped Docker Application Container Engine.
Aug 21 08:41:20 athens systemd[1]: docker.service: Start request repeated too quickly.
Aug 21 08:41:20 athens systemd[1]: docker.service: Failed with result 'exit-code'.
Aug 21 08:41:20 athens systemd[1]: Failed to start Docker Application Container Engine.
root@athens:/var/log#
So “journalctl -xe” and “systemctl status docker.service log” gave nothing useful….
So I searched for “docker.socket: Failed with result ‘service-start-limit-hit'” as it was the message that looked more suspicious. I landed here and tried one command to get more logs that I didnt know: “journaltctl -fu docker”
root@athens:/var/log# journalctl -fu docker
-- Logs begin at Sun 2020-02-02 21:12:23 GMT. --
Aug 21 08:42:41 athens dockerd[35469]: proto: duplicate proto type registered: io.containerd.cgroups.v1.RdmaStat
Aug 21 08:42:41 athens dockerd[35469]: proto: duplicate proto type registered: io.containerd.cgroups.v1.RdmaEntry
Aug 21 08:42:41 athens systemd[1]: docker.service: Main process exited, code=exited, status=1/FAILURE
Aug 21 08:42:41 athens systemd[1]: docker.service: Failed with result 'exit-code'.
Aug 21 08:42:41 athens systemd[1]: Failed to start Docker Application Container Engine.
Aug 21 08:42:41 athens systemd[1]: docker.service: Scheduled restart job, restart counter is at 3.
Aug 21 08:42:41 athens systemd[1]: Stopped Docker Application Container Engine.
Aug 21 08:42:41 athens systemd[1]: docker.service: Start request repeated too quickly.
Aug 21 08:42:41 athens systemd[1]: docker.service: Failed with result 'exit-code'.
Aug 21 08:42:41 athens systemd[1]: Failed to start Docker Application Container Engine.
Aug 21 08:44:32 athens systemd[1]: Starting Docker Application Container Engine…
Aug 21 08:44:32 athens dockerd[35538]: proto: duplicate proto type registered: io.containerd.cgroups.v1.Metrics
Aug 21 08:44:32 athens dockerd[35538]: proto: duplicate proto type registered: io.containerd.cgroups.v1.HugetlbStat
Aug 21 08:44:32 athens dockerd[35538]: unable to configure the Docker daemon with file /etc/docker/daemon.json: invalid character '"' after object key:value pair
Aug 21 08:44:32 athens dockerd[35538]: proto: duplicate proto type registered: io.containerd.cgroups.v1.PidsStat
Aug 21 08:44:32 athens dockerd[35538]: proto: duplicate proto type registered: io.containerd.cgroups.v1.CPUStat
Aug 21 08:44:32 athens dockerd[35538]: proto: duplicate proto type registered: io.containerd.cgroups.v1.CPUUsage
Aug 21 08:44:32 athens dockerd[35538]: proto: duplicate proto type registered: io.containerd.cgroups.v1.Throttle
Aug 21 08:44:32 athens dockerd[35538]: proto: duplicate proto type registered: io.containerd.cgroups.v1.MemoryStat
Aug 21 08:44:32 athens dockerd[35538]: proto: duplicate proto type registered: io.containerd.cgroups.v1.MemoryEntry
Aug 21 08:44:32 athens dockerd[35538]: proto: duplicate proto type registered: io.containerd.cgroups.v1.BlkIOStat
Aug 21 08:44:32 athens dockerd[35538]: proto: duplicate proto type registered: io.containerd.cgroups.v1.BlkIOEntry
Aug 21 08:44:32 athens dockerd[35538]: proto: duplicate proto type registered: io.containerd.cgroups.v1.RdmaStat
Aug 21 08:44:32 athens dockerd[35538]: proto: duplicate proto type registered: io.containerd.cgroups.v1.RdmaEntry
Aug 21 08:44:32 athens systemd[1]: docker.service: Main process exited, code=exited, status=1/FAILURE
Aug 21 08:44:32 athens systemd[1]: docker.service: Failed with result 'exit-code'.
Aug 21 08:44:32 athens systemd[1]: Failed to start Docker Application Container Engine.
Aug 21 08:44:32 athens systemd[1]: docker.service: Scheduled restart job, restart counter is at 1.
Aug 21 08:44:32 athens systemd[1]: Stopped Docker Application Container Engine.
And now, yes, I could see the docker logs properly… and found the culprit and fixed. I am pretty sure the last time I played with “/etc/docker/daemon.json” I restarted docker and it was fine…
Anyway, I learned a new command “journaltctl -fu SERVICE” to troubleshoot services.
As usual, I am following Anton’s blog and now I want to follow his series about Protobuf/gNMI. All merit and hard work is for the author. I am just doing copy/paste. All his code related to this topic is in his github repo:
First time I heard about protobuf was in the context of telemetry from Arista LANZ (44.3.7)
Now it is my chance to get some knowledge about it. Protobuf is a new data encoding type (like JSON) meant for speed mainly. Mayor things, this is a binary protocol. And we are going to use Protobuf to encode YANG/OpenConfig. And the transport protocol is going to be gNMI.
Index
0- Create python env
1- Install protobuf
2- Create and compile protobuf file for the OpenConfig modules openconfig-interfaces.yang.
3- Create python script to write protobuf message based on the model compiled earlier
4- Create python script to read that protobuf message
5- Use gNMI: Create python script to get interface configuration from cEOS
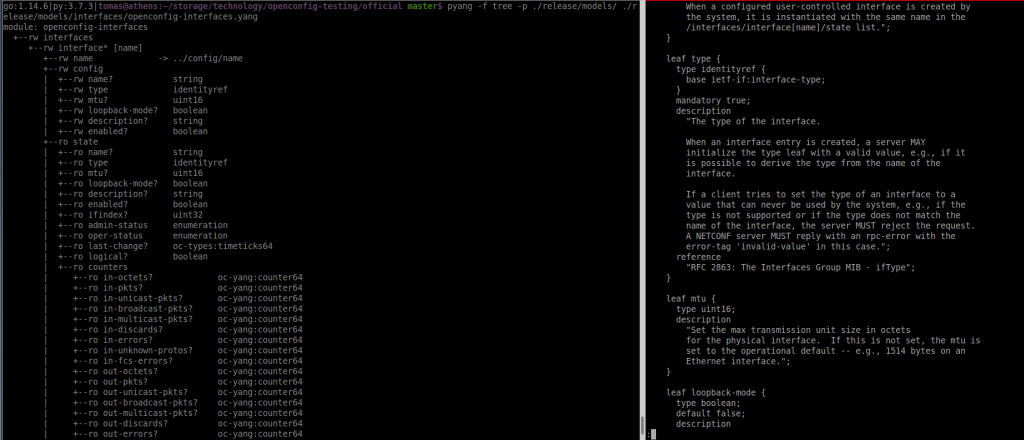
This is a quite difficult part. Try to install “pyang” for python and clone openconfig. Keep in mind that I have removed “ro” entries manually below:
$ ls -ltr
total 11
-rw-r--r-- 1 tomas tomas 1240 Aug 19 18:37 README.md
-rw-r--r-- 1 tomas tomas 11358 Aug 19 18:37 LICENSE
drwxr-xr-x 3 tomas tomas 4 Aug 19 18:37 release
drwxr-xr-x 4 tomas tomas 12 Aug 19 18:37 doc
drwxr-xr-x 3 tomas tomas 4 Aug 19 18:37 third_party
$
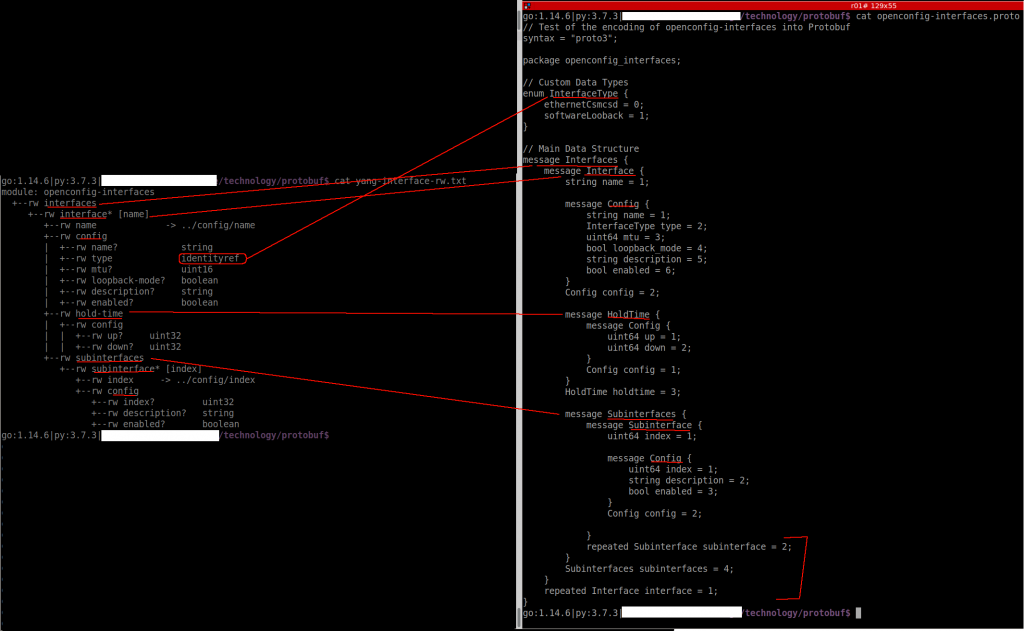
$ pyang -f tree -p ./release/models/ ./release/models/interfaces/openconfig-interfaces.yang
module: openconfig-interfaces
+--rw interfaces
+--rw interface* [name]
+--rw name -> ../config/name
+--rw config
| +--rw name? string
| +--rw type identityref
| +--rw mtu? uint16
| +--rw loopback-mode? boolean
| +--rw description? string
| +--rw enabled? boolean
+--rw hold-time
| +--rw config
| | +--rw up? uint32
| | +--rw down? uint32
+--rw subinterfaces
+--rw subinterface* [index]
+--rw index -> ../config/index
+--rw config
+--rw index? uint32
+--rw description? string
+--rw enabled? boolean
So this is the YANG model that we want to transform into protobuf.
To be honest, If I have to match that output with the content of the file itself, I dont understant it.
As Anton mentions, you need to check the official protobuf guide and protobuf python guide to create the proto file for the interface YANG model. These two links explain the structure of our new protofile.
In one side, I think I understand the process of converting YANG to Protobug. But I should try something myself to be sure 🙂
The .proto code doesn’t appear properly formatted in my blog so you can see it in the fig above or in github.
Compile:
$ protoc -I=. --python_out=. openconfig_interfaces.proto
$ ls -ltr | grep openconfig_interfaces
-rw-r--r-- 1 tomas tomas 1247 Aug 20 14:01 openconfig_interfaces.proto
-rw-r--r-- 1 tomas tomas 20935 Aug 20 14:03 openconfig_interfaces_pb2.py
3- Create python script to write protobuf
The script has a dict “intend” to be used to populate the proto message. Once it is populated with the info, it is written to a file as byte stream.
$ python create_protobuf.py oc_if.bin
$ file oc_if.bin
oc_if.bin: data
4- Create python script to read protobuf
This is based on the next blog entry of Anton’s series.
The script that read the protobuf message is here.
The challenge here is how he found out what files to use.
$ ls -ltr gnmi/proto/gnmi/
total 62
-rw-r--r-- 1 tomas tomas 21907 Aug 20 15:10 gnmi.proto
-rw-r--r-- 1 tomas tomas 125222 Aug 20 15:10 gnmi.pb.go
-rw-r--r-- 1 tomas tomas 76293 Aug 20 15:10 gnmi_pb2.py
-rw-r--r-- 1 tomas tomas 4864 Aug 20 15:10 gnmi_pb2_grpc.py
$
$ ls -ltr gnmi/proto/gnmi_ext/
total 14
-rw-r--r-- 1 tomas tomas 2690 Aug 20 15:10 gnmi_ext.proto
-rw-r--r-- 1 tomas tomas 19013 Aug 20 15:10 gnmi_ext.pb.go
-rw-r--r-- 1 tomas tomas 10191 Aug 20 15:10 gnmi_ext_pb2.py
-rw-r--r-- 1 tomas tomas 83 Aug 20 15:10 gnmi_ext_pb2_grpc.py
$
I can see the blog and github doesnt match and I can’t really follow. Based on that, I have created an script to get the interface config from one cEOS switch using gNMI interface:
$ cat gnmi_get_if_config.py
#!/usr/bin/env python

# Modules
import grpc
from bin.gnmi_pb2_grpc import *
from bin.gnmi_pb2 import *
import json
import pprint

# Own modules
from bin.PathGenerator import gnmi_path_generator

# Variables
path = {'inventory': 'inventory.json'}
info_to_collect = ['openconfig-interfaces:interfaces']


# User-defined functions
def json_to_dict(path):
    with open(path, 'r') as f:
        return json.loads(f.read())


# Body
if __name__ == '__main__':
    inventory = json_to_dict(path['inventory'])

    for td_entry in inventory['devices']:
        metadata = [('username', td_entry['username']), ('password', td_entry['password'])]

        channel = grpc.insecure_channel(f'{td_entry["ip_address"]}:{td_entry["port"]}', metadata)
        grpc.channel_ready_future(channel).result(timeout=5)

        stub = gNMIStub(channel)

        for itc_entry in info_to_collect:
            print(f'Getting data for {itc_entry} from {td_entry["hostname"]} over gNMI...\n')

            intent_path = gnmi_path_generator(itc_entry)
            print("gnmi_path:\n")
            print(intent_path)
            gnmi_message_request = GetRequest(path=[intent_path], type=0, encoding=4)
            gnmi_message_response = stub.Get(gnmi_message_request, metadata=metadata)
            # we get the outout of gnmi_response that is json as string of bytes
            x = gnmi_message_response.notification[0].update[0].val.json_ietf_val
            # decode the string of bytes as string and then transform to pure json
            y = json.loads(x.decode('utf-8'))
            #import ipdb; ipdb.set_trace()
            # print nicely json
            pprint.pprint(y)
This is my cEOS config:
r01#show management api gnmi
Enabled: Yes
Server: running on port 3333, in default VRF
SSL Profile: none
QoS DSCP: none
r01#
r01#
r01#show version
cEOSLab
Hardware version:
Serial number:
Hardware MAC address: 0242.ac8d.adef
System MAC address: 0242.ac8d.adef
Software image version: 4.23.3M
Architecture: i686
Internal build version: 4.23.3M-16431779.4233M
Internal build ID: afb8ec89-73bd-4410-b090-f000f70505bb
cEOS tools version: 1.1
Uptime: 6 weeks, 1 days, 3 hours and 13 minutes
Total memory: 8124244 kB
Free memory: 1923748 kB
r01#
r01#
r01#show ip interface brief
Address
Interface IP Address Status Protocol MTU Owner

Ethernet1 10.0.12.1/30 up up 1500
Ethernet2 10.0.13.1/30 up up 1500
Loopback1 10.0.0.1/32 up up 65535
Loopback2 192.168.0.1/32 up up 65535
Vlan100 1.1.1.1/24 up up 1500
r01#
And it seems to work:
$ python gnmi_get_if_config.py
Getting data for openconfig-interfaces:interfaces from r01 over gNMI…
gnmi_path:
origin: "openconfig-interfaces"
elem {
name: "interfaces"
}
{'openconfig-interfaces:interface': [{'config': {'arista-intf-augments:load-interval': 300,
'description': '',
'enabled': True,
'loopback-mode': False,
'mtu': 0,
'name': 'Ethernet2',
'openconfig-vlan:tpid': 'openconfig-vlan-types:TPID_0X8100',
'type': 'iana-if-type:ethernetCsmacd'},
Summary
It has been be interesting to play with ProtoBug and gNMI but I have just grasped the surface.
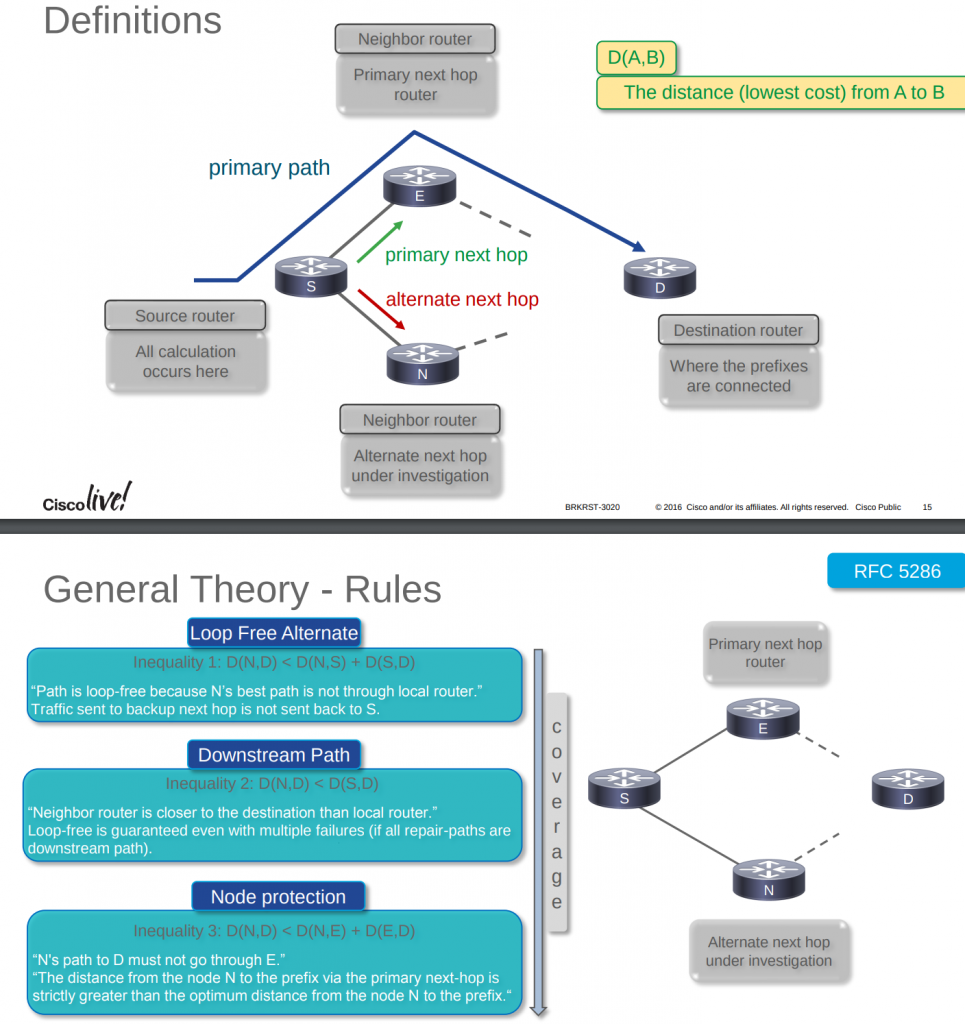
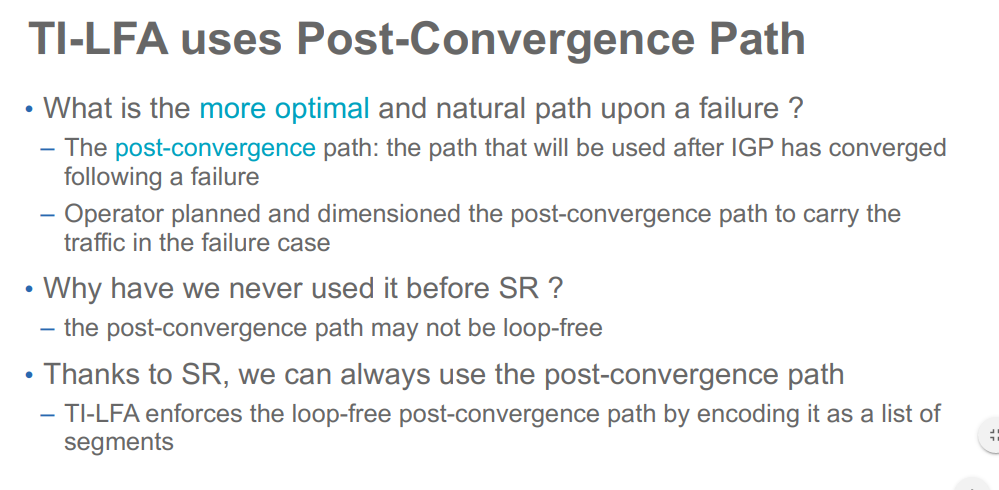
Segment Routing (SR) and Topology Independent Loop Free Alternates (TI-LFA)
Intro
As part of having a MPLS SR lab, I wanted to test FRR (Fast Rerouting) solutions. Arista provides support for FRR TI-LFA based on this link. Unfortunately, if you are not a customer you can’t see that 🙁
But there are other links where you can read about TI-LFA. The two from juniper confuses me when calculating P/Q groups in pre-converge time…
Juniper docs mention always “pre-convergence” but Cisco uses “post-convergence”. I think “post” it is more clear.
EOS TI-LFA Limitations
Backup paths are not computed for prefix segments that do not have a host mask (/32 for v4 and /128 for v6).
When TI-LFA is configured, the number of anycast segments generated by a node cannot exceed 10.
Computing TI-LFA backup paths for proxy node segments is not supported.
Backup paths are not computed for node segments corresponding to multi-homed prefixes. The multi-homing could be the result of them being anycast node segments, loopback interfaces on different routers advertising SIDs for the same prefix, node segments leaked between levels and thus being seen as originated from multiple L1-L2 routers.
Backup paths are only computed for segments that are non-ECMP.
Only IS-IS interfaces that are using the point-to-point network type are eligible for protection.
The backup paths are only computed with respect to link/node failure constraints. SRLG constraint is not yet supported.
Link/node protection only supported in the default VRF owing to the lack of non-default VRF support for IS-IS segment-routing.
Backup paths are computed in the same IS-IS level topology as the primary path.
Even with IS-IS GR configured, ASU2, SSO, agent restart are not hitless events for IS-IS SR LFIB routes or tunnels being protected by backup paths.
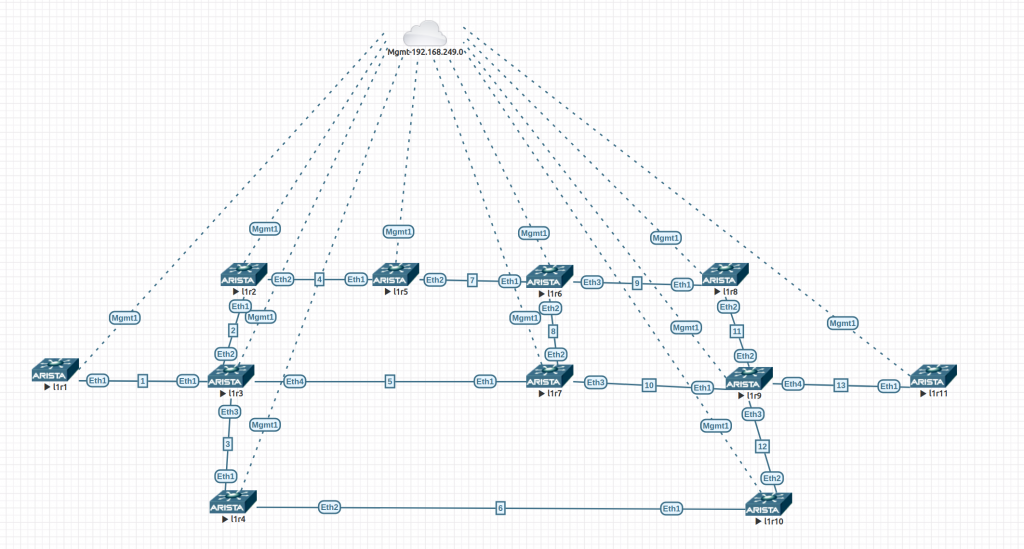
LAB
Based on this, I built a lab using 4.24.1.1F 64 bits on EVE-NG. All links have default ISIS cost of 10 (loopbacks are 1) and we have TI-LFA node-protection enabled globally.
Fig1. SR TI-LFA Lab
The config are quite simple. This is l1r9. The only change is the IP addressing. The links in the diagram show the third octet of the link address range.
!
service routing protocols model multi-agent
!
hostname l1r9
!
spanning-tree mode mstp
!
aaa authorization exec default local
!
no aaa root
!
vrf instance MGMT
!
interface Ethernet1
no switchport
ip address 10.0.10.2/30
isis enable CORE
isis network point-to-point
!
interface Ethernet2
no switchport
ip address 10.0.11.2/30
isis enable CORE
isis network point-to-point
!
interface Ethernet3
no switchport
ip address 10.0.12.1/30
isis enable CORE
isis network point-to-point
!
interface Ethernet4
no switchport
ip address 10.0.13.1/30
isis enable CORE
isis network point-to-point
!
interface Loopback1
description CORE Loopback
ip address 10.0.0.9/32
node-segment ipv4 index 9
isis enable CORE
isis metric 1
!
interface Management1
vrf MGMT
ip address 192.168.249.18/24
!
ip routing
ip routing vrf MGMT
!
ip route vrf MGMT 0.0.0.0/0 192.168.249.1
!
mpls ip
!
mpls label range isis-sr 800000 65536
!
router isis CORE
net 49.0000.0001.0010.0000.0000.0009.00
is-type level-2
log-adjacency-changes
timers local-convergence-delay protected-prefixes
set-overload-bit on-startup wait-for-bgp
!
address-family ipv4 unicast
bfd all-interfaces
fast-reroute ti-lfa mode node-protection
!
segment-routing mpls
router-id 10.0.0.9
no shutdown
adjacency-segment allocation sr-peers backup-eligible
!
management api http-commands
protocol unix-socket
no shutdown
!
vrf MGMT
no shutdown
!
Using this script (using nornir/napalm), I gather the output of all these commands from all routers:
"show isis segment-routing prefix-segments" -> shows if protection is enabled for these segments

"show isis segment-routing adjacency-segments" -> shows is protection is enabled for these segments

"show isis interface" -> shows state of protection configured

"show isis ti-lfa path" -> shows the repair path with the list of all the system IDs from the P-node to the Q-node for every destination/constraint tuple. You will see that even though node protection is configured a link protecting LFA is computed too. This is to fallback to link protecting LFAs whenever the node protecting LFA becomes unavailable.

"show isis ti-lfa tunnel" -> The TI-LFA repair tunnels are just internal constructs that are shared by multiple LFIB routes that compute similar repair paths. This command displays TI-LFA repair tunnels with the primary and backup via information.

"show isis segment-routing tunnel" -> command displays all the IS-IS SR tunnels. The field ‘ TI-LFA tunnel index ’ shows the index of the TI-LFA tunnel protecting the SR tunnel. The same TI-LFA tunnel that protects the LFIB route also protects the corresponding IS-IS SR tunnel.

"show tunnel fib" -> displays tunnels programmed in the tunnel FIB also includes the TI-LFA tunnels along with protected IS-IS SR tunnels.

"show mpls lfib route" -> displays the backup information along with the primary vias for all node/adjacency segments that have TI-LFA backup paths computed.

"show ip route" -> When services like LDP pseudowires, BGP LU, L2 EVPN or L3 MPLS VPN use IS-IS SR tunnels as an underlay, they are automatically protected by TI-LFA tunnels that protect the IS-IS SR tunnels. The ‘show ip route’ command displays the hierarchy of the overlay-underlay-TI-LFA tunnels like below.
This is the output of l1r3 in the initial state (no failures):
/////////////////////////////////////////////////////////////////////////
/// Device: l1r3 // /////////////////////////////////////////////////////////////////////////
command = show isis segment-routing prefix-segments
System ID: 0000.0000.0003 Instance: 'CORE'
SR supported Data-plane: MPLS SR Router ID: 10.0.0.3
Node: 11 Proxy-Node: 0 Prefix: 0 Total Segments: 11
Flag Descriptions: R: Re-advertised, N: Node Segment, P: no-PHP
E: Explicit-NULL, V: Value, L: Local
Segment status codes: * - Self originated Prefix, L1 - level 1, L2 - level 2
Prefix SID Type Flags System ID Level Protection
------------------------- ----- ---------- ----------------------- --------------- ----- ----------
10.0.0.1/32 1 Node R:0 N:1 P:0 E:0 V:0 L:0 0000.0000.0001 L2 node
10.0.0.2/32 2 Node R:0 N:1 P:0 E:0 V:0 L:0 0000.0000.0002 L2 node
* 10.0.0.3/32 3 Node R:0 N:1 P:0 E:0 V:0 L:0 0000.0000.0003 L2 unprotected
10.0.0.4/32 4 Node R:0 N:1 P:0 E:0 V:0 L:0 0000.0000.0004 L2 node
10.0.0.5/32 5 Node R:0 N:1 P:0 E:0 V:0 L:0 0000.0000.0005 L2 node
10.0.0.6/32 6 Node R:0 N:1 P:0 E:0 V:0 L:0 0000.0000.0006 L2 node
10.0.0.7/32 7 Node R:0 N:1 P:0 E:0 V:0 L:0 0000.0000.0007 L2 node
10.0.0.8/32 8 Node R:0 N:1 P:0 E:0 V:0 L:0 0000.0000.0008 L2 node
10.0.0.9/32 9 Node R:0 N:1 P:0 E:0 V:0 L:0 0000.0000.0009 L2 node
10.0.0.10/32 10 Node R:0 N:1 P:0 E:0 V:0 L:0 0000.0000.0010 L2 node
10.0.0.11/32 11 Node R:0 N:1 P:0 E:0 V:0 L:0 0000.0000.0011 L2 node
================================================================================
command = show isis segment-routing adjacency-segments
System ID: l1r3 Instance: CORE
SR supported Data-plane: MPLS SR Router ID: 10.0.0.3
Adj-SID allocation mode: SR-adjacencies
Adj-SID allocation pool: Base: 100000 Size: 16384
Adjacency Segment Count: 4
Flag Descriptions: F: Ipv6 address family, B: Backup, V: Value
L: Local, S: Set
Segment Status codes: L1 - Level-1 adjacency, L2 - Level-2 adjacency, P2P - Point-to-Point adjacency, LAN - Broadcast adjacency
Locally Originated Adjacency Segments
Adj IP Address Local Intf SID SID Source Flags Type
--------------- ----------- ------- ------------ --------------------- --------
10.0.1.1 Et1 100000 Dynamic F:0 B:1 V:1 L:1 S:0 P2P L2
10.0.2.1 Et2 100001 Dynamic F:0 B:1 V:1 L:1 S:0 P2P L2
10.0.5.2 Et4 100002 Dynamic F:0 B:1 V:1 L:1 S:0 P2P L2
10.0.3.2 Et3 100003 Dynamic F:0 B:1 V:1 L:1 S:0 P2P L2
Protection
----------
node
node
node
node
================================================================================
command = show isis interface
IS-IS Instance: CORE VRF: default
Interface Loopback1:
Index: 12 SNPA: 0:0:0:0:0:0
MTU: 65532 Type: loopback
Area Proxy Boundary is Disabled
Node segment Index IPv4: 3
BFD IPv4 is Enabled
BFD IPv6 is Disabled
Hello Padding is Enabled
Level 2:
Metric: 1 (Passive Interface)
Authentication mode: None
TI-LFA protection is disabled for IPv4
TI-LFA protection is disabled for IPv6
Interface Ethernet1:
Index: 13 SNPA: P2P
MTU: 1497 Type: point-to-point
Area Proxy Boundary is Disabled
BFD IPv4 is Enabled
BFD IPv6 is Disabled
Hello Padding is Enabled
Level 2:
Metric: 10, Number of adjacencies: 1
Link-ID: 0D
Authentication mode: None
TI-LFA node protection is enabled for the following IPv4 segments: node segments, adjacency segments
TI-LFA protection is disabled for IPv6
Interface Ethernet2:
Index: 14 SNPA: P2P
MTU: 1497 Type: point-to-point
Area Proxy Boundary is Disabled
BFD IPv4 is Enabled
BFD IPv6 is Disabled
Hello Padding is Enabled
Level 2:
Metric: 10, Number of adjacencies: 1
Link-ID: 0E
Authentication mode: None
TI-LFA node protection is enabled for the following IPv4 segments: node segments, adjacency segments
TI-LFA protection is disabled for IPv6
Interface Ethernet3:
Index: 15 SNPA: P2P
MTU: 1497 Type: point-to-point
Area Proxy Boundary is Disabled
BFD IPv4 is Enabled
BFD IPv6 is Disabled
Hello Padding is Enabled
Level 2:
Metric: 10, Number of adjacencies: 1
Link-ID: 0F
Authentication mode: None
TI-LFA node protection is enabled for the following IPv4 segments: node segments, adjacency segments
TI-LFA protection is disabled for IPv6
Interface Ethernet4:
Index: 16 SNPA: P2P
MTU: 1497 Type: point-to-point
Area Proxy Boundary is Disabled
BFD IPv4 is Enabled
BFD IPv6 is Disabled
Hello Padding is Enabled
Level 2:
Metric: 10, Number of adjacencies: 1
Link-ID: 10
Authentication mode: None
TI-LFA node protection is enabled for the following IPv4 segments: node segments, adjacency segments
TI-LFA protection is disabled for IPv6
================================================================================
command = show isis ti-lfa path
TI-LFA paths for IPv4 address family
Topo-id: Level-2
Destination Constraint Path
----------------- --------------------------------- --------------
l1r2 exclude node 0000.0000.0002 Path not found
exclude Ethernet2 l1r6
l1r8 exclude Ethernet4 l1r4
exclude node 0000.0000.0007 l1r4
l1r9 exclude Ethernet4 l1r4
exclude node 0000.0000.0007 l1r4
l1r11 exclude Ethernet4 l1r4
exclude node 0000.0000.0007 l1r4
l1r10 exclude Ethernet3 l1r7
exclude node 0000.0000.0004 l1r7
l1r1 exclude node 0000.0000.0001 Path not found
exclude Ethernet1 Path not found
l1r6 exclude Ethernet4 l1r2
exclude node 0000.0000.0007 l1r2
l1r7 exclude node 0000.0000.0007 Path not found
exclude Ethernet4 l1r10
l1r4 exclude Ethernet3 l1r9
exclude node 0000.0000.0004 Path not found
l1r5 exclude Ethernet2 l1r7
exclude node 0000.0000.0002 l1r7
================================================================================
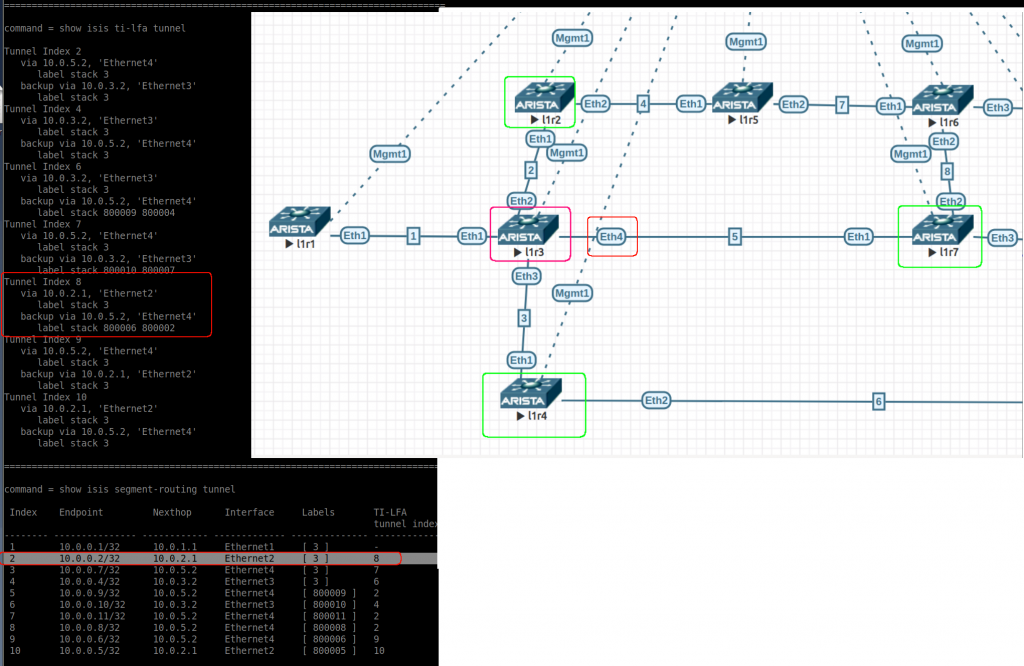
command = show isis ti-lfa tunnel
Tunnel Index 2
via 10.0.5.2, 'Ethernet4'
label stack 3
backup via 10.0.3.2, 'Ethernet3'
label stack 3
Tunnel Index 4
via 10.0.3.2, 'Ethernet3'
label stack 3
backup via 10.0.5.2, 'Ethernet4'
label stack 3
Tunnel Index 6
via 10.0.3.2, 'Ethernet3'
label stack 3
backup via 10.0.5.2, 'Ethernet4'
label stack 800009 800004
Tunnel Index 7
via 10.0.5.2, 'Ethernet4'
label stack 3
backup via 10.0.3.2, 'Ethernet3'
label stack 800010 800007
Tunnel Index 8
via 10.0.2.1, 'Ethernet2'
label stack 3
backup via 10.0.5.2, 'Ethernet4'
label stack 800006 800002
Tunnel Index 9
via 10.0.5.2, 'Ethernet4'
label stack 3
backup via 10.0.2.1, 'Ethernet2'
label stack 3
Tunnel Index 10
via 10.0.2.1, 'Ethernet2'
label stack 3
backup via 10.0.5.2, 'Ethernet4'
label stack 3
================================================================================
command = show isis segment-routing tunnel
Index Endpoint Nexthop Interface Labels TI-LFA
tunnel index
-------- --------------- ------------ ------------- -------------- ------------
1 10.0.0.1/32 10.0.1.1 Ethernet1 [ 3 ] -
2 10.0.0.2/32 10.0.2.1 Ethernet2 [ 3 ] 8
3 10.0.0.7/32 10.0.5.2 Ethernet4 [ 3 ] 7
4 10.0.0.4/32 10.0.3.2 Ethernet3 [ 3 ] 6
5 10.0.0.9/32 10.0.5.2 Ethernet4 [ 800009 ] 2
6 10.0.0.10/32 10.0.3.2 Ethernet3 [ 800010 ] 4
7 10.0.0.11/32 10.0.5.2 Ethernet4 [ 800011 ] 2
8 10.0.0.8/32 10.0.5.2 Ethernet4 [ 800008 ] 2
9 10.0.0.6/32 10.0.5.2 Ethernet4 [ 800006 ] 9
10 10.0.0.5/32 10.0.2.1 Ethernet2 [ 800005 ] 10
================================================================================
command = show tunnel fib
Type 'IS-IS SR', index 1, endpoint 10.0.0.1/32, forwarding None
via 10.0.1.1, 'Ethernet1' label 3
Type 'IS-IS SR', index 2, endpoint 10.0.0.2/32, forwarding None
via TI-LFA tunnel index 8 label 3
via 10.0.2.1, 'Ethernet2' label 3
backup via 10.0.5.2, 'Ethernet4' label 800006 800002
Type 'IS-IS SR', index 3, endpoint 10.0.0.7/32, forwarding None
via TI-LFA tunnel index 7 label 3
via 10.0.5.2, 'Ethernet4' label 3
backup via 10.0.3.2, 'Ethernet3' label 800010 800007
Type 'IS-IS SR', index 4, endpoint 10.0.0.4/32, forwarding None
via TI-LFA tunnel index 6 label 3
via 10.0.3.2, 'Ethernet3' label 3
backup via 10.0.5.2, 'Ethernet4' label 800009 800004
Type 'IS-IS SR', index 5, endpoint 10.0.0.9/32, forwarding None
via TI-LFA tunnel index 2 label 800009
via 10.0.5.2, 'Ethernet4' label 3
backup via 10.0.3.2, 'Ethernet3' label 3
Type 'IS-IS SR', index 6, endpoint 10.0.0.10/32, forwarding None
via TI-LFA tunnel index 4 label 800010
via 10.0.3.2, 'Ethernet3' label 3
backup via 10.0.5.2, 'Ethernet4' label 3
Type 'IS-IS SR', index 7, endpoint 10.0.0.11/32, forwarding None
via TI-LFA tunnel index 2 label 800011
via 10.0.5.2, 'Ethernet4' label 3
backup via 10.0.3.2, 'Ethernet3' label 3
Type 'IS-IS SR', index 8, endpoint 10.0.0.8/32, forwarding None
via TI-LFA tunnel index 2 label 800008
via 10.0.5.2, 'Ethernet4' label 3
backup via 10.0.3.2, 'Ethernet3' label 3
Type 'IS-IS SR', index 9, endpoint 10.0.0.6/32, forwarding None
via TI-LFA tunnel index 9 label 800006
via 10.0.5.2, 'Ethernet4' label 3
backup via 10.0.2.1, 'Ethernet2' label 3
Type 'IS-IS SR', index 10, endpoint 10.0.0.5/32, forwarding None
via TI-LFA tunnel index 10 label 800005
via 10.0.2.1, 'Ethernet2' label 3
backup via 10.0.5.2, 'Ethernet4' label 3
Type 'TI-LFA', index 2, forwarding None
via 10.0.5.2, 'Ethernet4' label 3
backup via 10.0.3.2, 'Ethernet3' label 3
Type 'TI-LFA', index 4, forwarding None
via 10.0.3.2, 'Ethernet3' label 3
backup via 10.0.5.2, 'Ethernet4' label 3
Type 'TI-LFA', index 6, forwarding None
via 10.0.3.2, 'Ethernet3' label 3
backup via 10.0.5.2, 'Ethernet4' label 800009 800004
Type 'TI-LFA', index 7, forwarding None
via 10.0.5.2, 'Ethernet4' label 3
backup via 10.0.3.2, 'Ethernet3' label 800010 800007
Type 'TI-LFA', index 8, forwarding None
via 10.0.2.1, 'Ethernet2' label 3
backup via 10.0.5.2, 'Ethernet4' label 800006 800002
Type 'TI-LFA', index 9, forwarding None
via 10.0.5.2, 'Ethernet4' label 3
backup via 10.0.2.1, 'Ethernet2' label 3
Type 'TI-LFA', index 10, forwarding None
via 10.0.2.1, 'Ethernet2' label 3
backup via 10.0.5.2, 'Ethernet4' label 3
================================================================================
command = show mpls lfib route
MPLS forwarding table (Label [metric] Vias) - 14 routes
MPLS next-hop resolution allow default route: False
Via Type Codes:
M - MPLS via, P - Pseudowire via,
I - IP lookup via, V - VLAN via,
VA - EVPN VLAN aware via, ES - EVPN ethernet segment via,
VF - EVPN VLAN flood via, AF - EVPN VLAN aware flood via,
NG - Nexthop group via
Source Codes:
G - gRIBI, S - Static MPLS route,
B2 - BGP L2 EVPN, B3 - BGP L3 VPN,
R - RSVP, LP - LDP pseudowire,
L - LDP, M - MLDP,
IP - IS-IS SR prefix segment, IA - IS-IS SR adjacency segment,
IL - IS-IS SR segment to LDP, LI - LDP to IS-IS SR segment,
BL - BGP LU, ST - SR TE policy,
DE - Debug LFIB
IA 100000 [1]
via M, 10.0.1.1, pop
payload autoDecide, ttlMode uniform, apply egress-acl
interface Ethernet1
IA 100001 [1]
via TI-LFA tunnel index 8, pop
payload autoDecide, ttlMode uniform, apply egress-acl
via 10.0.2.1, Ethernet2, label imp-null(3)
backup via 10.0.5.2, Ethernet4, label 800006 800002
IA 100002 [1]
via TI-LFA tunnel index 7, pop
payload autoDecide, ttlMode uniform, apply egress-acl
via 10.0.5.2, Ethernet4, label imp-null(3)
backup via 10.0.3.2, Ethernet3, label 800010 800007
IA 100003 [1]
via TI-LFA tunnel index 6, pop
payload autoDecide, ttlMode uniform, apply egress-acl
via 10.0.3.2, Ethernet3, label imp-null(3)
backup via 10.0.5.2, Ethernet4, label 800009 800004
IP 800001 [1], 10.0.0.1/32
via M, 10.0.1.1, pop
payload autoDecide, ttlMode uniform, apply egress-acl
interface Ethernet1
IP 800002 [1], 10.0.0.2/32
via TI-LFA tunnel index 8, pop
payload autoDecide, ttlMode uniform, apply egress-acl
via 10.0.2.1, Ethernet2, label imp-null(3)
backup via 10.0.5.2, Ethernet4, label 800006 800002
IP 800004 [1], 10.0.0.4/32
via TI-LFA tunnel index 6, pop
payload autoDecide, ttlMode uniform, apply egress-acl
via 10.0.3.2, Ethernet3, label imp-null(3)
backup via 10.0.5.2, Ethernet4, label 800009 800004
IP 800005 [1], 10.0.0.5/32
via TI-LFA tunnel index 10, swap 800005
payload autoDecide, ttlMode uniform, apply egress-acl
via 10.0.2.1, Ethernet2, label imp-null(3)
backup via 10.0.5.2, Ethernet4, label imp-null(3)
IP 800006 [1], 10.0.0.6/32
via TI-LFA tunnel index 9, swap 800006
payload autoDecide, ttlMode uniform, apply egress-acl
via 10.0.5.2, Ethernet4, label imp-null(3)
backup via 10.0.2.1, Ethernet2, label imp-null(3)
IP 800007 [1], 10.0.0.7/32
via TI-LFA tunnel index 7, pop
payload autoDecide, ttlMode uniform, apply egress-acl
via 10.0.5.2, Ethernet4, label imp-null(3)
backup via 10.0.3.2, Ethernet3, label 800010 800007
IP 800008 [1], 10.0.0.8/32
via TI-LFA tunnel index 2, swap 800008
payload autoDecide, ttlMode uniform, apply egress-acl
via 10.0.5.2, Ethernet4, label imp-null(3)
backup via 10.0.3.2, Ethernet3, label imp-null(3)
IP 800009 [1], 10.0.0.9/32
via TI-LFA tunnel index 2, swap 800009
payload autoDecide, ttlMode uniform, apply egress-acl
via 10.0.5.2, Ethernet4, label imp-null(3)
backup via 10.0.3.2, Ethernet3, label imp-null(3)
IP 800010 [1], 10.0.0.10/32
via TI-LFA tunnel index 4, swap 800010
payload autoDecide, ttlMode uniform, apply egress-acl
via 10.0.3.2, Ethernet3, label imp-null(3)
backup via 10.0.5.2, Ethernet4, label imp-null(3)
IP 800011 [1], 10.0.0.11/32
via TI-LFA tunnel index 2, swap 800011
payload autoDecide, ttlMode uniform, apply egress-acl
via 10.0.5.2, Ethernet4, label imp-null(3)
backup via 10.0.3.2, Ethernet3, label imp-null(3)
================================================================================
command = show ip route
VRF: default
Codes: C - connected, S - static, K - kernel,
O - OSPF, IA - OSPF inter area, E1 - OSPF external type 1,
E2 - OSPF external type 2, N1 - OSPF NSSA external type 1,
N2 - OSPF NSSA external type2, B - BGP, B I - iBGP, B E - eBGP,
R - RIP, I L1 - IS-IS level 1, I L2 - IS-IS level 2,
O3 - OSPFv3, A B - BGP Aggregate, A O - OSPF Summary,
NG - Nexthop Group Static Route, V - VXLAN Control Service,
DH - DHCP client installed default route, M - Martian,
DP - Dynamic Policy Route, L - VRF Leaked,
RC - Route Cache Route
Gateway of last resort is not set
I L2 10.0.0.1/32 [115/11] via 10.0.1.1, Ethernet1
I L2 10.0.0.2/32 [115/11] via 10.0.2.1, Ethernet2
C 10.0.0.3/32 is directly connected, Loopback1
I L2 10.0.0.4/32 [115/11] via 10.0.3.2, Ethernet3
I L2 10.0.0.5/32 [115/21] via 10.0.2.1, Ethernet2
I L2 10.0.0.6/32 [115/21] via 10.0.5.2, Ethernet4
I L2 10.0.0.7/32 [115/11] via 10.0.5.2, Ethernet4
I L2 10.0.0.8/32 [115/31] via 10.0.5.2, Ethernet4
I L2 10.0.0.9/32 [115/21] via 10.0.5.2, Ethernet4
I L2 10.0.0.10/32 [115/21] via 10.0.3.2, Ethernet3
I L2 10.0.0.11/32 [115/31] via 10.0.5.2, Ethernet4
C 10.0.1.0/30 is directly connected, Ethernet1
C 10.0.2.0/30 is directly connected, Ethernet2
C 10.0.3.0/30 is directly connected, Ethernet3
I L2 10.0.4.0/30 [115/20] via 10.0.2.1, Ethernet2
C 10.0.5.0/30 is directly connected, Ethernet4
I L2 10.0.6.0/30 [115/20] via 10.0.3.2, Ethernet3
I L2 10.0.7.0/30 [115/30] via 10.0.2.1, Ethernet2
via 10.0.5.2, Ethernet4
I L2 10.0.8.0/30 [115/20] via 10.0.5.2, Ethernet4
I L2 10.0.9.0/30 [115/30] via 10.0.5.2, Ethernet4
I L2 10.0.10.0/30 [115/20] via 10.0.5.2, Ethernet4
I L2 10.0.11.0/30 [115/30] via 10.0.5.2, Ethernet4
I L2 10.0.12.0/30 [115/30] via 10.0.3.2, Ethernet3
via 10.0.5.2, Ethernet4
I L2 10.0.13.0/30 [115/30] via 10.0.5.2, Ethernet4
================================================================================
In l1r3 we can see:
show isis segment-routing prefix-segments: all prefix segments are under “node” protection (apart from itself – 10.0.0.3/32)
show isis segment-routing adjacency-segments: all adjacent segments are under “node” protection.
show isis interface: All isis enabled interfaces (apart from loopback1) have TI-LFA node protection enabled for ipv4.
show isis ti-lfa path: Here we can see link and node protection to all possible destinations in our ISIS domain (all P routers in our BGP-Free core). When node protection is not possible, link protection is calculated. The exception is l1r1 because it has only one link into the networks, so if that is lost, there is no backup at all.
show isis ti-lfa tunnel: This can be confusing. These are the TI-LFA tunnels, the first two lines refer to the path they are protecting. The last two lines are really the tunnel configuration. Another interesting thing here is the label stack for some backup tunnels (index 6, 7, 8). This a way to avoid a loop. The index is used in the next command.
show isis segment-routing tunnel: Here we see the current SR tunnels and the corresponding backup (index that refers to above command). Label [3] is the implicit null label. Paying attention to the endpoint “10.0.0.2/32” (as per fig2 below). We can see the primary path is via eth2. The backup is via tunnel index 8 (via eth4 – l1r7). If you check the path to “10.0.0.2/32 – 800002” from l1r7 (output after fig2) you can see it is pointing back to l1r3 and we would have a loop! For this reason the backup tunnel index 8 in l1r3 has a label stack to avoid this loop (800006 800002). Once l1r7 received this packet and checks the segment labels, it sends the packet to 800006 via eth2 (l1r6) and then l1r6 uses 8000002 to reach finally l1r2 (via l1r5).
show tunnel fib: you can see all “IS-IS SR” and “TI-LFA” tunnels defined. It is like a merge of “show isis segment-routing tunnel” and “show isis ti-lfa tunnel”.
show mpls lfib route: You can see the programmed labels and TI-LFA. I’ve got confused when I see “imp-null” and the I see some pop/swap for the same entry…
show ip route: nothing really interesting without L3VPNS
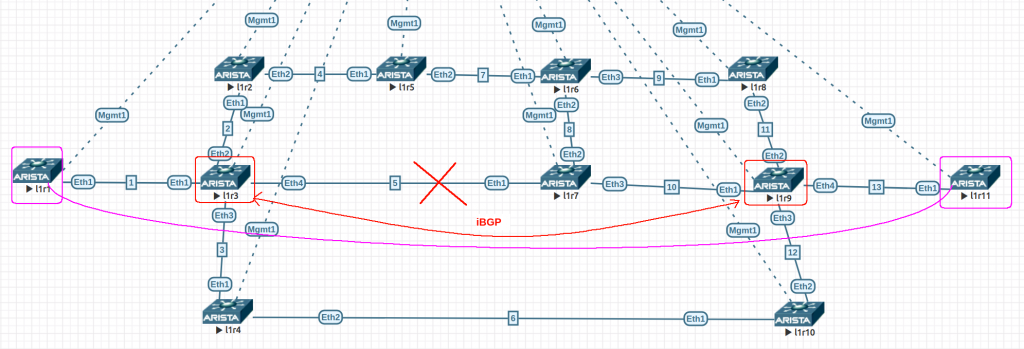
Testing
Ok, you need to generate traffic that is labelled to really test TI-LFA and with enough packet rate to see if you are close to the 50ms recovery promissed.
So I have had to make some changes:
create a L3VPN CUST-A (evpn) in l1r3 and l1r9, so they are PEs
l1r1 and l1r11 are CPE in VRF CUST-A
All other devices have no changes
We need to test with and without TI-LFA enabled. The test I have do is to ping from l1r1 to l1r11 and dropping the link l1r3-l1r7, while l1r3 has enabled/disabled TI-LFA.
Fig3 – Testing Scenario
Routing changes with TI-LFA enabled
BEFORE DROPPING LINK
======

l1r3#show ip route vrf CUST-A

 B I      10.0.13.0/30 [200/0] via 10.0.0.9/32, IS-IS SR tunnel index 5, label 116384
                                  via TI-LFA tunnel index 4, label 800009
                                     via 10.0.5.2, Ethernet4, label imp-null(3)
                                     backup via 10.0.3.2, Ethernet3, label imp-null(3)
 C        192.168.0.3/32 is directly connected, Loopback2
 B I      192.168.0.9/32 [200/0] via 10.0.0.9/32, IS-IS SR tunnel index 5, label 116384
                                    via TI-LFA tunnel index 4, label 800009
                                       via 10.0.5.2, Ethernet4, label imp-null(3)
                                       backup via 10.0.3.2, Ethernet3, label imp-null(3)

AFTER DROPPING LINK
======

l1r3#show ip route vrf CUST-A

 B I      10.0.13.0/30 [200/0] via 10.0.0.9/32, IS-IS SR tunnel index 5, label 116384
                                  via TI-LFA tunnel index 11, label 800009
                                     via 10.0.3.2, Ethernet3, label imp-null(3)
                                     backup via 10.0.2.1, Ethernet2, label 800005
 C        192.168.0.3/32 is directly connected, Loopback2
 B I      192.168.0.9/32 [200/0] via 10.0.0.9/32, IS-IS SR tunnel index 5, label 116384
                                    via TI-LFA tunnel index 11, label 800009
                                       via 10.0.3.2, Ethernet3, label imp-null(3)
For some time, I wanted to take a look at kubernetes. There is a lot of talking about microservices in the cloud and after attending some meetups, I wasnt sure what was all this about so I signed for kodekloud to learn about it.
So far, I have completed the beginners course for Docker and Kubernetes. To be honest, I think the product is very good value for money.
I have been using docker a bit the last couple of months but still wanted to take a bit more info to improve my knowledge.
I was surprised when reading that kubernets pods rely on docker images.
Docker Notes
Docker commands
docker run -it xxx (interactive+pseudoterminal)
docker run -d xxx (detach)
docker attach ID (attach)
docker run --name TEST xxx (provide name to container)
docker run -p 80:5000 xxx (maps host port 80 to container port 5000)

docker run -v /opt/datadir:/var/lib/mysql mysql (map a host folder to container folder for data persistence)

docker run -e APP_COLOR=blue xxx (pass env var to the container)
docker inspect "container"  -> check IP, env vars, etc
docker logs "container"

docker build . -t account_name/app_name
docker login
docker push account_name/app_name

docker -H=remote-docker-engine:2375 xxx

cgroups: restrict resources in container
  docker run --cpus=.5  xxx (no more than 50% CPU)
  docker run --memory=100m xxx (no more than 100M memory)
Docker File
----
FROM Ubuntu
ENTRYPOINT ["sleep"]
CMD ["5"]        --> if you dont pass any value in "docker run .." it uses by default 5.
----
docker volume create NAME  --> create /var/lib/docker/volumes/NAME

docker run -v NAME:/var/lib/mysql mysql  (docker volume)
or
docker run -v PATH:/var/lib/mysql mysql  (local folder)
or
docker run --mount type=bind,source=/data/mysql,target=/var/lib/mysql mysql
Docker Networking
networks: --network=xxx
 bridge (default)
 none   isolation
 host (only communication with other containers)

docker network create --driver bridge --subnet x.x.x.x/x NAME
docker network ls
               inspect
Docker Swarm
I didnt use this, just had the theory. This is for clustering docker hosts: manager, workers.
container + orchestration
 (docker)    (kubernetes)

node: virtual or physical, kube is installed here
cluster: set of nodes
master: node that manage clusters

kube components:
  api,
  etcd (key-value store),
  scheduler (distribute load),
  kubelet (agent),
  controller (brain: check status),
  container runtime (sw to run containers: docker)

master: api, etcd, controller, scheduler,
   $ kubectl cluster-info
           get nodes -o wide (extra info)
node: kubelet, container
Setup Kubernetes with minikube
Setting up kubernetes doesnt look like an easy task so there are tools to do that like microk8s, kubeadm (my laptop needs more RAM, can’t handle 1master+2nodes) and minikube.
minikube needs: virtualbox(couldnt make it work with kvm2…) and kubectl
Pods are the smallest deployable units of computing that you can create and manage in Kubernetes.
A Pod is a group of one or more containers, with shared storage/network resources, and a specification for how to run the containers. A Pod's contents are always co-located and co-scheduled, and run in a shared context. A Pod models an application-specific "logical host": it contains one or more application containers which are relatively tightly coupled. In non-cloud contexts, applications executed on the same physical or virtual machine are analogous to cloud applications executed on the same logical host.
$ kubectl run nginx --image=nginx
$ kubectl describe pod nginx
$ kubectl get pods -o wi
$ kubectl delete pod nginx
A ReplicaSet's purpose is to maintain a stable set of replica Pods running at any given time. As such, it is often used to guarantee the availability of a specified number of identical Pods.
A Deployment provides declarative updates for PodsReplicaSets.
You describe a desired state in a Deployment, and the Deployment Controller changes the actual state to the desired state at a controlled rate. You can define Deployments to create new ReplicaSets, or to remove existing Deployments and adopt all their resources with new Deployments.
Not handled natively by kubernetes, you need another tool like calico, weave, etc. More info here. This has not been covered in details yet. It looks complex (a network engineer talking…)
An abstract way to expose an application running on a set of Pods as a network service.
With Kubernetes you don't need to modify your application to use an unfamiliar service discovery mechanism. Kubernetes gives Pods their own IP addresses and a single DNS name for a set of Pods, and can load-balance across them.
types:
   NodePort: like docker port-mapping
   ClusterIP:
   LoadBalancer
Examples:
nodeport
--------
service: like a virtual server
  targetport - in the pod: 80
  service - 80
  nodeport: 30080 (in the node)

service-definition.yml
apiVersion: v1
kind: Service
metadata:
  name: mypapp-service
spec:
  type: NodePort
  ports:
  - targetPort: 80
    port: 80
    nodePort: 30080  (range: 30000-32767)
  selector:
    app: myapp
    type: front-end

> kubectl create -f service-definition.yml
> kubectl get services
> minikube service mypapp-service


clusterip:
---------
service-definition.yml
apiVersion: v1
kind: Service
metadata:
  name: back-end
spec:
  type: ClusterIP
  ports:
  - targetPort: 80
    port: 80
  selector:
    app: myapp
    type: back-end


loadbalance: gcp, aws, azure only !!!!
-----------
service-definition.yml
apiVersion: v1
kind: Service
metadata:
  name: back-end
spec:
  type: LoadBalancer
  ports:
  - targetPort: 80
    port: 80
    nodePort: 30080
  selector:
    app: myapp


> kubectl create -f service-definition.yml
> kubectl get services
Microservices architecture example
Diagram
=======

voting-app     result-app
 (python)       (nodejs)
   |(1)           ^ (4)
   v              |
in-memoryDB       db
 (redis)       (postgresql)
    ^ (2)         ^ (3)
    |             |
    ------- -------
          | |
         worker
          (.net)

1- deploy containers -> deploy PODs (deployment)
2- enable connectivity -> create service clusterIP for redis
                          create service clusterIP for postgres
3- external access -> create service NodePort for voting
                      create service NodePort for result
This is a very good presentation about optical stuff from NANOG 70 (2017). And I noticed there is an updated version from NANOG 77 (2019). I watched the 2017 (2h) and there is something always bites me: db vs dbm
Close to the end, there are some common questions about optical that he provides answers. I liked the ones about “looking at the lasers can make you blind” and the point that is worth cleaning your fibers. A bit about cleaning here.
I am still trying to play with / understand Openconfig/YANG/Netconf modelling. Initially I tried to use ansible to configure EOS via netconf but I didnt get very far 🙁
I have found an Arista blog to deal with netconf using the python library ncclient.
This is my adapted code. Keep in mind that I think there is a typo/bug in Arista blog in “def irbrpc(..)” as it should return “snetrpc” instead of “irbrpc”. This is the error I had:
Traceback (most recent call last):
File "eos-ncc.py", line 171, in
main()
File "eos-ncc.py", line 168, in main
execrpc(hostip, uname, passw, rpc)
File "eos-ncc.py", line 7, in execrpc
rpcreply = conn.dispatch(to_ele(rpc))
File "xxx/lib/python3.7/site-packages/ncclient/xml_.py", line 126, in to_ele
return x if etree.iselement(x) else etree.fromstring(x.encode('UTF-8'), parser=_get_parser(huge_tree))
AttributeError: 'function' object has no attribute 'encode'
After a couple of prints in “ncclient/xml_.py” I could see “x” was a function but I couldnt understand why. Just by chance I notices the typo in the return.
As well, I couldn’t configure the vxlan interface using XML as per the blog and I had to remove it and add it via a RPC call with CLI commands “intfrpcvxlan_cli”. This is the error I had:
Traceback (most recent call last):
File "eos-ncc.py", line 171, in
main()
File "eos-ncc.py", line 168, in main
execrpc(hostip, uname, passw, rpc)
File "eos-ncc.py", line 7, in execrpc
rpcreply = conn.dispatch(to_ele(rpc))
File "xxx/lib/python3.7/site-packages/ncclient/manager.py", line 236, in execute
huge_tree=self._huge_tree).request(*args, **kwds)
File "xxx/lib/python3.7/site-packages/ncclient/operations/retrieve.py", line 239, in request
return self._request(node)
File "xxx/lib/python3.7/site-packages/ncclient/operations/rpc.py", line 348, in _request
raise self._reply.error
ncclient.operations.rpc.RPCError: Request could not be completed because leafref at path "/interfaces/interface[name='Vxlan1']/name" had error "leaf value (Vxlan1) not present in reference path (../config/name)"
So in my script, I make two calls and print the reply:
I still would like to be able to get the full config via netconf. Just copy/paste the rpc in the ssh shell (like juniper) or maybe using ydk like this. And keep dreaming, to be able to fully configure the switch via netconf/ansible.