I get mad whenever I hear “work hard” lately. What the f* that means? Do I need to stay in my desk for 16 hours every day? This is what I understand for working hard. I am subscribed to the SDN mail list of IPSpace and this week the email was about this topic and related to network automation. My former CTO told me one day “work smarter, not harder”. I am not very smart, but I try. And one key thing, it is focus.
Day: 8 November 2020
Apple-Pie
To celebrate a new lockdown season, I wanted to cook an apple pie like my mum used to make and I think I found a recipe that looks like that.
Ingredients:
1- 150g of biscuits smashed (my tin was a bit bigger than the video)
2- 70g melted butter
3- 8 apples, peeled and core removed – 6 for the sauce and 2 for decoration
4- 1 glass of milk (around 250ml)
5- 1 glass of plain flour (same glass as above)
6- 1/2 glass of suggar (same glass as above)
7- a pintch of cinnamon
8- Some tbsp of marmalade (or maple syrup as I ran out)
Process
1- Use a bit of butter to cover the bottom of your tin. Mix your crashed biscuits with the butter and fill the bottom of the tin. Be sure it looks like a firm surface. Put the tin in the fridge to cool down.
2- Pre-heat oven at 180C
3- In a blender, put the 6 chopped apples, milk, flour, sugar and cinnamon. After a couple of minutes, check everything is fully combined and liquid-like.
4- Take the tin from the bridge, and pour the apple mix on the tin. Be sure it is level. Then cut the other two apples in slices and cover the apple mix.
5- Put the cake in the over for around 60 minutes. The top should be brown and if you push a knife in the cake should come out clean.
6- Once the cake is out of the oven. Use the marmalade to bright up the surface of the cake.
7- Let the cake to cool in the fridge (1h) and ready to eat!
I actually liked it and I think it is similar to the one I used to have as a kid. Good memories!

gnmi-ssl-p2
I was already playing with gNMI and protobuf a couple of months ago. But this week I received a summary from the last NANOG80 meeting and there was a presentation about it. Great job from Colin!
So I decided to give it a go as the demo was based on docker and I have already my Arista lab in cEOS and vEOS as targets.
I started my 3node-ring cEOS lab with docker-topo
ceos-testing/topology master$ docker-topo --create 3-node-simple.yml
INFO:main:Version 2 requires sudo. Restarting script with sudo
[sudo] password for xxx:
INFO:main:
alias r01='docker exec -it 3node_r01 Cli'
alias r02='docker exec -it 3node_r02 Cli'
alias r03='docker exec -it 3node_r03 Cli'
INFO:main:All devices started successfully
Checked they were up:
$ docker ps -a
CONTAINER ID IMAGE COMMAND CREATED STATUS PORTS NAMES
4160cc354ba2 ceos-lab:4.23.3M "/sbin/init systemd.…" 7 minutes ago Up 7 minutes 0.0.0.0:2002->22/tcp, 0.0.0.0:9002->443/tcp 3node_r03
122f72fb25bd ceos-lab:4.23.3M "/sbin/init systemd.…" 7 minutes ago Up 7 minutes 0.0.0.0:2001->22/tcp, 0.0.0.0:9001->443/tcp 3node_r02
68cf8ca39130 ceos-lab:4.23.3M "/sbin/init systemd.…" 7 minutes ago Up 7 minutes 0.0.0.0:2000->22/tcp, 0.0.0.0:9000->443/tcp 3node_r01
And then, check I had gnmi config in r01:
!
management api gnmi
transport grpc GRPC
port 3333
!
Need to find the IP of r01 in “3node_net-0” as the one used for management. I have had so many times hit this issue,…
$ docker inspect 3node_r01 ..."Networks": {"3node_net-0": {"IPAMConfig": null,"Links": null,"Aliases": [ "68cf8ca39130" ],"NetworkID": "d3f72e7473228488f668aa3ed65b6ea94e1c5c9553f93cf0f641c3d4af644e2e", "EndpointID": "bca584040e71a826ef25b8360d92881dad407ff976eff65a38722fd36e9fc873", "Gateway": "172.20.0.1","IPAddress": "172.20.0.2",....
Now, I cloned the repo and followed the instructions/video. Copied targets.jon and updated it with my r01 device details:
~/storage/technology/gnmi-gateway release$ cat examples/gnmi-prometheus/targets.json
{
  "request": {
    "default": {
      "subscribe": {
        "prefix": {
        },
        "subscription": [
          {
            "path": {
              "elem": [
                {
                  "name": "interfaces"
                }
              ]
            }
          }
        ]
      }
    }
  },
  "target": {
    "r01": {
      "addresses": [
        "172.20.0.2:3333"
      ],
      "credentials": {
        "username": "xxx",
        "password": "xxx"
      },
      "request": "default",
      "meta": {
        "NoTLS": "yes"
      }
    }
  }
}
Carrying out with the instructions, build docker gnmi-gateway, docker bridge and run docker gnmi-gateway built earlier.
go:1.14.6|py:3.7.3|tomas@athens:~/storage/technology/gnmi-gateway release$ docker run \
-it --rm \
-p 59100:59100 \
-v $(pwd)/examples/gnmi-prometheus/targets.json:/opt/gnmi-gateway/targets.json \
--name gnmi-gateway-01 \
--network gnmi-net \
gnmi-gateway:latest
{"level":"info","time":"2020-11-07T16:54:28Z","message":"Starting GNMI Gateway."}
{"level":"info","time":"2020-11-07T16:54:28Z","message":"Clustering is NOT enabled. No locking or cluster coordination will happen."}
{"level":"info","time":"2020-11-07T16:54:28Z","message":"Starting connection manager."}
{"level":"info","time":"2020-11-07T16:54:28Z","message":"Starting gNMI server on 0.0.0.0:9339."}
{"level":"info","time":"2020-11-07T16:54:28Z","message":"Starting Prometheus exporter."}
{"level":"info","time":"2020-11-07T16:54:28Z","message":"Connection manager received a target control message: 1 inserts 0 removes"}
{"level":"info","time":"2020-11-07T16:54:28Z","message":"Initializing target r01 ([172.27.0.2:3333]) map[NoTLS:yes]."}
{"level":"info","time":"2020-11-07T16:54:28Z","message":"Target r01: Connecting"}
{"level":"info","time":"2020-11-07T16:54:28Z","message":"Target r01: Subscribing"}
{"level":"info","time":"2020-11-07T16:54:28Z","message":"Starting Prometheus HTTP server."}
{"level":"info","time":"2020-11-07T16:54:38Z","message":"Target r01: Disconnected"}
E1107 16:54:38.382032 1 reconnect.go:114] client.Subscribe (target "r01") failed: client "gnmi" : client "gnmi" : Dialer(172.27.0.2:3333, 10s): context deadline exceeded; reconnecting in 552.330144ms
{"level":"info","time":"2020-11-07T16:54:48Z","message":"Target r01: Disconnected"}
E1107 16:54:48.935965 1 reconnect.go:114] client.Subscribe (target "r01") failed: client "gnmi" : client "gnmi" : Dialer(172.27.0.2:3333, 10s): context deadline exceeded; reconnecting in 1.080381816s
bash-4.2# tcpdump -i any tcp port 3333 -nnn
tcpdump: verbose output suppressed, use -v or -vv for full protocol decode
listening on any, link-type LINUX_SLL (Linux cooked v1), capture size 262144 bytes
17:07:57.621011 In 02:42:7c:61:10:40 ethertype IPv4 (0x0800), length 76: 172.27.0.1.43644 > 172.27.0.2.3333: Flags [S], seq 557316949, win 64240, options [mss 1460,sackOK,TS val 3219811744 ecr 0,nop,wscale 7], length 0
17:07:57.621069 Out 02:42:ac:1b:00:02 ethertype IPv4 (0x0800), length 76: 172.27.0.2.3333 > 172.27.0.1.43644: Flags [S.], seq 243944609, ack 557316950, win 65160, options [mss 1460,sackOK,TS val 1828853442 ecr 3219811744,nop,wscale 7], length 0
17:07:57.621124 In 02:42:7c:61:10:40 ethertype IPv4 (0x0800), length 68: 172.27.0.1.43644 > 172.27.0.2.3333: Flags [.], ack 1, win 502, options [nop,nop,TS val 3219811744 ecr 1828853442], length 0
17:07:57.621348 Out 02:42:ac:1b:00:02 ethertype IPv4 (0x0800), length 89: 172.27.0.2.3333 > 172.27.0.1.43644: Flags [P.], seq 1:22, ack 1, win 510, options [nop,nop,TS val 1828853442 ecr 3219811744], length 21
17:07:57.621409 In 02:42:7c:61:10:40 ethertype IPv4 (0x0800), length 68: 172.27.0.1.43644 > 172.27.0.2.3333: Flags [.], ack 22, win 502, options [nop,nop,TS val 3219811744 ecr 1828853442], length 0
17:07:57.621492 In 02:42:7c:61:10:40 ethertype IPv4 (0x0800), length 320: 172.27.0.1.43644 > 172.27.0.2.3333: Flags [P.], seq 1:253, ack 22, win 502, options [nop,nop,TS val 3219811744 ecr 1828853442], length 252
17:07:57.621509 Out 02:42:ac:1b:00:02 ethertype IPv4 (0x0800), length 68: 172.27.0.2.3333 > 172.27.0.1.43644: Flags [.], ack 253, win 509, options [nop,nop,TS val 1828853442 ecr 3219811744], length 0
17:07:57.621586 In 02:42:7c:61:10:40 ethertype IPv4 (0x0800), length 68: 172.27.0.1.43644 > 172.27.0.2.3333: Flags [F.], seq 253, ack 22, win 502, options [nop,nop,TS val 3219811744 ecr 1828853442], length 0
17:07:57.621904 Out 02:42:ac:1b:00:02 ethertype IPv4 (0x0800), length 68: 172.27.0.2.3333 > 172.27.0.1.43644: Flags [R.], seq 22, ack 254, win 509, options [nop,nop,TS val 1828853443 ecr 3219811744], length 0
Ok, the container is created and seems running but the gnmi-gateway can’t connect to my cEOS r01….
First thing, I had to check iptables. It is not the first time that when playing with docker and building different environments (vEOS vs gnmi-gateway) with different docker commands, iptables may be not configured properly.
And it was the case again:
# iptables -t filter -S DOCKER-ISOLATION-STAGE-1
Warning: iptables-legacy tables present, use iptables-legacy to see them
-N DOCKER-ISOLATION-STAGE-1
-A DOCKER-ISOLATION-STAGE-1 -i br-43481af25965 ! -o br-43481af25965 -j DOCKER-ISOLATION-STAGE-2
-A DOCKER-ISOLATION-STAGE-1 -j ACCEPT
-A DOCKER-ISOLATION-STAGE-1 -i docker0 ! -o docker0 -j DOCKER-ISOLATION-STAGE-2
-A DOCKER-ISOLATION-STAGE-1 -i br-94c1e813ad6f ! -o br-94c1e813ad6f -j DOCKER-ISOLATION-STAGE-2
-A DOCKER-ISOLATION-STAGE-1 -i br-4bd17cfa19a8 ! -o br-4bd17cfa19a8 -j DOCKER-ISOLATION-STAGE-2
-A DOCKER-ISOLATION-STAGE-1 -i br-13ab2b6a0d1d ! -o br-13ab2b6a0d1d -j DOCKER-ISOLATION-STAGE-2
-A DOCKER-ISOLATION-STAGE-1 -i br-121978ca0282 ! -o br-121978ca0282 -j DOCKER-ISOLATION-STAGE-2
-A DOCKER-ISOLATION-STAGE-1 -i br-00db5844bbb0 ! -o br-00db5844bbb0 -j DOCKER-ISOLATION-STAGE-2
-A DOCKER-ISOLATION-STAGE-1 -j RETURN
So I moved the new docker bridge network for gnmi-gateway after “ACCEPT” and solved.
# iptables -t filter -D DOCKER-ISOLATION-STAGE-1 -j ACCEPT
# iptables -t filter -I DOCKER-ISOLATION-STAGE-1 -j ACCEPT
#
# iptables -t filter -S DOCKER-ISOLATION-STAGE-1
Warning: iptables-legacy tables present, use iptables-legacy to see them
-N DOCKER-ISOLATION-STAGE-1
-A DOCKER-ISOLATION-STAGE-1 -j ACCEPT
-A DOCKER-ISOLATION-STAGE-1 -i br-43481af25965 ! -o br-43481af25965 -j DOCKER-ISOLATION-STAGE-2
-A DOCKER-ISOLATION-STAGE-1 -i docker0 ! -o docker0 -j DOCKER-ISOLATION-STAGE-2
-A DOCKER-ISOLATION-STAGE-1 -i br-94c1e813ad6f ! -o br-94c1e813ad6f -j DOCKER-ISOLATION-STAGE-2
-A DOCKER-ISOLATION-STAGE-1 -i br-4bd17cfa19a8 ! -o br-4bd17cfa19a8 -j DOCKER-ISOLATION-STAGE-2
-A DOCKER-ISOLATION-STAGE-1 -i br-13ab2b6a0d1d ! -o br-13ab2b6a0d1d -j DOCKER-ISOLATION-STAGE-2
-A DOCKER-ISOLATION-STAGE-1 -i br-121978ca0282 ! -o br-121978ca0282 -j DOCKER-ISOLATION-STAGE-2
-A DOCKER-ISOLATION-STAGE-1 -i br-00db5844bbb0 ! -o br-00db5844bbb0 -j DOCKER-ISOLATION-STAGE-2
-A DOCKER-ISOLATION-STAGE-1 -j RETURN
#
So, restarted gnmi-gateway, still same issue. Ok, I decided to check if the packets were actually hitting r01.
So at first sight, the tcp handshake is established but then there is TCP RST….
So I double checked that gnmi was runnig in my side:
r1#show management api gnmi
Enabled:            Yes
Server:             running on port 3333, in MGMT VRF
SSL Profile:        none
QoS DSCP:           none
r1#
At that moment, I thought that was an issue in cEOS… checking logs I couldnt see any confirmation but I decided to give it a go with vEOS that is more feature rich. So I turned up my GCP lab and followed the same steps with gnmi-gateway. I updated the targets.json with the details of one of my vEOS devices. And run again:
~/gnmi/gnmi-gateway release$ sudo docker run -it --rm -p 59100:59100 -v $(pwd)/examples/gnmi-prometheus/targets.json:/opt/gnmi-gateway/targets.json --name gnmi-gateway-01 --network gnmi-net gnmi-gateway:latest
{"level":"info","time":"2020-11-07T19:22:20Z","message":"Starting GNMI Gateway."}
{"level":"info","time":"2020-11-07T19:22:20Z","message":"Clustering is NOT enabled. No locking or cluster coordination will happen."}
{"level":"info","time":"2020-11-07T19:22:20Z","message":"Starting connection manager."}
{"level":"info","time":"2020-11-07T19:22:20Z","message":"Starting gNMI server on 0.0.0.0:9339."}
{"level":"info","time":"2020-11-07T19:22:20Z","message":"Starting Prometheus exporter."}
{"level":"info","time":"2020-11-07T19:22:20Z","message":"Connection manager received a target control message: 1 inserts 0 removes"}
{"level":"info","time":"2020-11-07T19:22:20Z","message":"Initializing target gcp-r1 ([192.168.249.4:3333]) map[NoTLS:yes]."}
{"level":"info","time":"2020-11-07T19:22:20Z","message":"Target gcp-r1: Connecting"}
{"level":"info","time":"2020-11-07T19:22:20Z","message":"Target gcp-r1: Subscribing"}
{"level":"info","time":"2020-11-07T19:22:20Z","message":"Starting Prometheus HTTP server."}
{"level":"info","time":"2020-11-07T19:22:30Z","message":"Target gcp-r1: Disconnected"}
E1107 19:22:30.048410 1 reconnect.go:114] client.Subscribe (target "gcp-r1") failed: client "gnmi" : client "gnmi" : Dialer(192.168.249.4:3333, 10s): context deadline exceeded; reconnecting in 552.330144ms
{"level":"info","time":"2020-11-07T19:22:40Z","message":"Target gcp-r1: Disconnected"}
E1107 19:22:40.603141 1 reconnect.go:114] client.Subscribe (target "gcp-r1") failed: client "gnmi" : client "gnmi" : Dialer(192.168.249.4:3333, 10s): context deadline exceeded; reconnecting in 1.080381816s
Again, same issue. Let’s see from vEOS perspective.
bash-4.2# tcpdump -i any tcp port 3333 -nnn
tcpdump: verbose output suppressed, use -v or -vv for full protocol decode
listening on any, link-type LINUX_SLL (Linux cooked v1), capture size 262144 bytes
18:52:31.874137 In 1e:3d:5b:13:d8:fe ethertype IPv4 (0x0800), length 76: 10.128.0.4.56546 > 192.168.249.4.3333: Flags [S], seq 4076065498, win 64240, options [mss 1460,sackOK,TS val 1752943121 ecr 0,nop,wscale 7], length 0
18:52:31.874579 Out 50:00:00:04:00:00 ethertype IPv4 (0x0800), length 76: 192.168.249.4.3333 > 10.128.0.4.56546: Flags [S.], seq 3922060793, ack 4076065499, win 28960, options [mss 1460,sackOK,TS val 433503 ecr 1752943121,nop,wscale 7], length 0
18:52:31.875882 In 1e:3d:5b:13:d8:fe ethertype IPv4 (0x0800), length 68: 10.128.0.4.56546 > 192.168.249.4.3333: Flags [.], ack 1, win 502, options [nop,nop,TS val 1752943123 ecr 433503], length 0
18:52:31.876284 In 1e:3d:5b:13:d8:fe ethertype IPv4 (0x0800), length 320: 10.128.0.4.56546 > 192.168.249.4.3333: Flags [P.], seq 1:253, ack 1, win 502, options [nop,nop,TS val 1752943124 ecr 433503], length 252
18:52:31.876379 Out 50:00:00:04:00:00 ethertype IPv4 (0x0800), length 68: 192.168.249.4.3333 > 10.128.0.4.56546: Flags [.], ack 253, win 235, options [nop,nop,TS val 433504 ecr 1752943124], length 0
18:52:31.929448 Out 50:00:00:04:00:00 ethertype IPv4 (0x0800), length 89: 192.168.249.4.3333 > 10.128.0.4.56546: Flags [P.], seq 1:22, ack 253, win 235, options [nop,nop,TS val 433517 ecr 1752943124], length 21
18:52:31.930028 In 1e:3d:5b:13:d8:fe ethertype IPv4 (0x0800), length 68: 10.128.0.4.56546 > 192.168.249.4.3333: Flags [.], ack 22, win 502, options [nop,nop,TS val 1752943178 ecr 433517], length 0
18:52:31.930090 In 1e:3d:5b:13:d8:fe ethertype IPv4 (0x0800), length 68: 10.128.0.4.56546 > 192.168.249.4.3333: Flags [F.], seq 253, ack 22, win 502, options [nop,nop,TS val 1752943178 ecr 433517], length 0
18:52:31.931603 Out 50:00:00:04:00:00 ethertype IPv4 (0x0800), length 68: 192.168.249.4.3333 > 10.128.0.4.56546: Flags [R.], seq 22, ack 254, win 235, options [nop,nop,TS val 433517 ecr 1752943178], length 0
So again in GCP, tcp is established but then TCP RST. As vEOS is my last resort, I tried to dig into that TCP connection. I downloaded a pcap to analyze with wireshark so get a better visual clue…
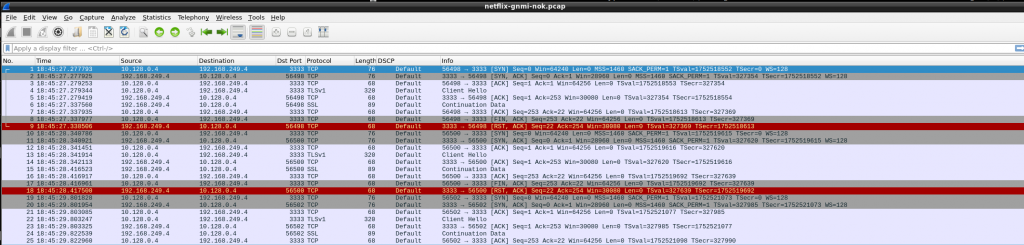
So, somehow, gnmi-gateway is trying to negotiate TLS!!! As per my understanding, my targets.json was configured with “NoTLS”: “yes” so that should be avoid, shouldn’t be?
At that moment, I wanted to know how to identfiy TLS/SSL packets using tcpdump as it is not always that easy to get quickly a pcap in wireshark. So I found the answer here:
bash-4.2# tcpdump -i any "tcp port 3333 and (tcp[((tcp[12] & 0xf0) >> 2)] = 0x16)"
tcpdump: verbose output suppressed, use -v or -vv for full protocol decode
listening on any, link-type LINUX_SLL (Linux cooked v1), capture size 262144 bytes
19:47:01.367197 In 1e:3d:5b:13:d8:fe (oui Unknown) ethertype IPv4 (0x0800), length 320: 10.128.0.4.50486 > 192.168.249.4.dec-notes: Flags [P.], seq 2715923852:2715924104, ack 2576249027, win 511, options [nop,nop,TS val 1194424180 ecr 1250876], length 252
19:47:02.405870 In 1e:3d:5b:13:d8:fe (oui Unknown) ethertype IPv4 (0x0800), length 320: 10.128.0.4.50488 > 192.168.249.4.dec-notes: Flags [P.], seq 680803294:680803546, ack 3839769659, win 511, options [nop,nop,TS val 1194425218 ecr 1251136], length 252
19:47:04.139458 In 1e:3d:5b:13:d8:fe (oui Unknown) ethertype IPv4 (0x0800), length 320: 10.128.0.4.50490 > 192.168.249.4.dec-notes: Flags [P.], seq 3963338234:3963338486, ack 1760248652, win 511, options [nop,nop,TS val 1194426952 ecr 1251569], length 252
Not something easy to remember 🙁
Ok, I wanted to be sure that gnmi was functional in vEOS and by a quick internet look up, I found this project gnmic! Great job by the author!
So I configured the tool and tested with my vEOS. And worked (without needing TLS)
~/gnmi/gnmi-gateway release$ gnmic -a 192.168.249.4:3333 -u xxx -p xxx --insecure --insecure get \
--path "/interfaces/interface[name=*]/subinterfaces/subinterface[index=*]/ipv4/addresses/address/config/ip"
Get Response:
[
{
"time": "1970-01-01T00:00:00Z",
"updates": [
{
"Path": "interfaces/interface[name=Management1]/subinterfaces/subinterface[index=0]/ipv4/addresses/address[ip=192.168.249.4]/config/ip",
"values": {
"interfaces/interface/subinterfaces/subinterface/ipv4/addresses/address/config/ip": "192.168.249.4"
}
},
{
"Path": "interfaces/interface[name=Ethernet2]/subinterfaces/subinterface[index=0]/ipv4/addresses/address[ip=10.0.13.1]/config/ip",
"values": {
"interfaces/interface/subinterfaces/subinterface/ipv4/addresses/address/config/ip": "10.0.13.1"
}
},
{
"Path": "interfaces/interface[name=Ethernet3]/subinterfaces/subinterface[index=0]/ipv4/addresses/address[ip=192.168.1.1]/config/ip",
"values": {
"interfaces/interface/subinterfaces/subinterface/ipv4/addresses/address/config/ip": "192.168.1.1"
}
},
{
"Path": "interfaces/interface[name=Ethernet1]/subinterfaces/subinterface[index=0]/ipv4/addresses/address[ip=10.0.12.1]/config/ip",
"values": {
"interfaces/interface/subinterfaces/subinterface/ipv4/addresses/address/config/ip": "10.0.12.1"
}
},
{
"Path": "interfaces/interface[name=Loopback1]/subinterfaces/subinterface[index=0]/ipv4/addresses/address[ip=10.0.0.1]/config/ip",
"values": {
"interfaces/interface/subinterfaces/subinterface/ipv4/addresses/address/config/ip": "10.0.0.1"
}
},
{
"Path": "interfaces/interface[name=Loopback2]/subinterfaces/subinterface[index=0]/ipv4/addresses/address[ip=192.168.0.1]/config/ip",
"values": {
"interfaces/interface/subinterfaces/subinterface/ipv4/addresses/address/config/ip": "192.168.0.1"
}
}
]
}
]
~/gnmi/gnmi-gateway release$
So, I kind of I was sure that my issue was configuring gnmi-gateway. I tried to troubleshoot it: removed the NoTLS, using the debugging mode, build the code, read the Go code for Target (too complex for my Goland knowledge 🙁 )
So at the end, I gave up and opened an issue with gnmi-gateway author. And he answered super quick with the solution!!! I misunderstood the meaning of “NoTLS” 🙁
So I followed his instructions to configure TLS in my gnmi cEOS config
security pki certificate generate self-signed r01.crt key r01.key generate rsa 2048 validity 30000 parameters common-name r01
!
management api gnmi
transport grpc GRPC
ssl profile SELFSIGNED
port 3333
!
...
!
management security
ssl profile SELFSIGNED
certificate r01.crt key r01.key
!
end
and all worked straightaway!
~/storage/technology/gnmi-gateway release$ docker run -it --rm -p 59100:59100 -v $(pwd)/examples/gnmi-prometheus/targets.json:/opt/gnmi-gateway/targets.json --name gnmi-gateway-01 --network gnmi-net gnmi-gateway:latest
{"level":"info","time":"2020-11-08T09:39:15Z","message":"Starting GNMI Gateway."}
{"level":"info","time":"2020-11-08T09:39:15Z","message":"Clustering is NOT enabled. No locking or cluster coordination will happen."}
{"level":"info","time":"2020-11-08T09:39:15Z","message":"Starting connection manager."}
{"level":"info","time":"2020-11-08T09:39:15Z","message":"Starting gNMI server on 0.0.0.0:9339."}
{"level":"info","time":"2020-11-08T09:39:15Z","message":"Starting Prometheus exporter."}
{"level":"info","time":"2020-11-08T09:39:15Z","message":"Connection manager received a target control message: 1 inserts 0 removes"}
{"level":"info","time":"2020-11-08T09:39:15Z","message":"Initializing target r01 ([172.20.0.2:3333]) map[NoTLS:yes]."}
{"level":"info","time":"2020-11-08T09:39:15Z","message":"Target r01: Connecting"}
{"level":"info","time":"2020-11-08T09:39:15Z","message":"Target r01: Subscribing"}
{"level":"info","time":"2020-11-08T09:39:15Z","message":"Target r01: Connected"}
{"level":"info","time":"2020-11-08T09:39:15Z","message":"Target r01: Synced"}
{"level":"info","time":"2020-11-08T09:39:16Z","message":"Starting Prometheus HTTP server."}
{"level":"info","time":"2020-11-08T09:39:45Z","message":"Connection manager received a target control message: 1 inserts 0 removes"}
{"level":"info","time":"2020-11-08T09:40:15Z","message":"Connection manager received a target control message: 1 inserts 0 removes"}
So I can start prometheus
~/storage/technology/gnmi-gateway release$ docker run \
-it --rm \
-p 9090:9090 \
-v $(pwd)/examples/gnmi-prometheus/prometheus.yml:/etc/prometheus/prometheus.yml \
--name prometheus-01 \
--network gnmi-net \
prom/prometheus
Unable to find image 'prom/prometheus:latest' locally
latest: Pulling from prom/prometheus
76df9210b28c: Pull complete
559be8e06c14: Pull complete
66945137dd82: Pull complete
8cbce0960be4: Pull complete
f7bd1c252a58: Pull complete
6ad12224c517: Pull complete
ee9cd36fa25a: Pull complete
d73034c1b9c3: Pull complete
b7103b774752: Pull complete
2ba5d8ece07a: Pull complete
ab11729a0297: Pull complete
1549b85a3587: Pull complete
Digest: sha256:b899dbd1b9017b9a379f76ce5b40eead01a62762c4f2057eacef945c3c22d210
Status: Downloaded newer image for prom/prometheus:latest
level=info ts=2020-11-08T09:40:26.622Z caller=main.go:315 msg="No time or size retention was set so using the default time retention" duration=15d
level=info ts=2020-11-08T09:40:26.623Z caller=main.go:353 msg="Starting Prometheus" version="(version=2.22.1, branch=HEAD, revision=00f16d1ac3a4c94561e5133b821d8e4d9ef78ec2)"
level=info ts=2020-11-08T09:40:26.623Z caller=main.go:358 build_context="(go=go1.15.3, user=root@516b109b1732, date=20201105-14:02:25)"
level=info ts=2020-11-08T09:40:26.623Z caller=main.go:359 host_details="(Linux 5.9.0-1-amd64 #1 SMP Debian 5.9.1-1 (2020-10-17) x86_64 b0fadf4a4c80 (none))"
level=info ts=2020-11-08T09:40:26.623Z caller=main.go:360 fd_limits="(soft=1048576, hard=1048576)"
level=info ts=2020-11-08T09:40:26.623Z caller=main.go:361 vm_limits="(soft=unlimited, hard=unlimited)"
level=info ts=2020-11-08T09:40:26.641Z caller=main.go:712 msg="Starting TSDB …"
level=info ts=2020-11-08T09:40:26.641Z caller=web.go:516 component=web msg="Start listening for connections" address=0.0.0.0:9090
level=info ts=2020-11-08T09:40:26.668Z caller=head.go:642 component=tsdb msg="Replaying on-disk memory mappable chunks if any"
level=info ts=2020-11-08T09:40:26.669Z caller=head.go:656 component=tsdb msg="On-disk memory mappable chunks replay completed" duration=103.51µs
level=info ts=2020-11-08T09:40:26.669Z caller=head.go:662 component=tsdb msg="Replaying WAL, this may take a while"
level=info ts=2020-11-08T09:40:26.672Z caller=head.go:714 component=tsdb msg="WAL segment loaded" segment=0 maxSegment=0
level=info ts=2020-11-08T09:40:26.672Z caller=head.go:719 component=tsdb msg="WAL replay completed" checkpoint_replay_duration=123.684µs wal_replay_duration=2.164743ms total_replay_duration=3.357021ms
level=info ts=2020-11-08T09:40:26.675Z caller=main.go:732 fs_type=2fc12fc1
level=info ts=2020-11-08T09:40:26.676Z caller=main.go:735 msg="TSDB started"
level=info ts=2020-11-08T09:40:26.676Z caller=main.go:861 msg="Loading configuration file" filename=/etc/prometheus/prometheus.yml
level=info ts=2020-11-08T09:40:26.684Z caller=main.go:892 msg="Completed loading of configuration file" filename=/etc/prometheus/prometheus.yml totalDuration=7.601103ms remote_storage=22.929µs web_handler=623ns query_engine=1.64µs scrape=5.517391ms scrape_sd=359.447µs notify=18.349µs notify_sd=3.921µs rules=15.744µs
level=info ts=2020-11-08T09:40:26.685Z caller=main.go:684 msg="Server is ready to receive web requests."
Now we can open prometheus UI and verify if we are consuming data from cEOS r01.
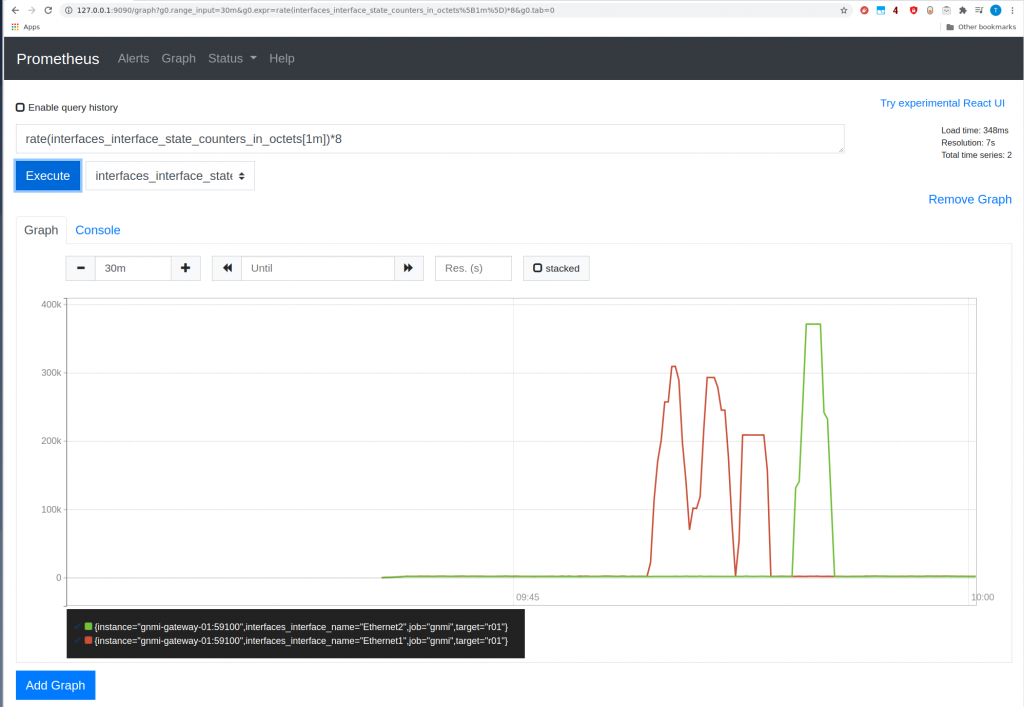
Yeah! it is there.
So all working at then. It has a nice experience. At the end of the day, I want to know more about gNMI/protobuffer, etc. The cold thing here is you can get telemetry and configuration management of your devices. So using gnmi-gateway (that is more for a high availability env like Netflix) and gnmic are great tools to get your head around.
Other lab I want to try is this eos-gnmi-telemetry-grafana.
The to-do list always keeps growing.