NVIDIA provides this course for free. Although I surprised that there is no much “free” documentation about this technology. I wish they follow the same path as most networking vendors where they want you to learn their technology without much barriers. And it is quite pathetic that you can’t really find books about it…
The course is very very high level and very very short. So I didnt become an Infiniband CCIE…
— Elements of IB: IB switch, Subnet Manager (it is like a SDN controller), hosts (clients), adaptors (NICs), gateways (convert IB <> Ethernet) and IB routers.
— Simplify mgmt: because of the Subnet Manager
— High bw: up to 400G)
— Cpu offload: RDMA, bypass OS.
— Ultra low latency: 1us host to host.
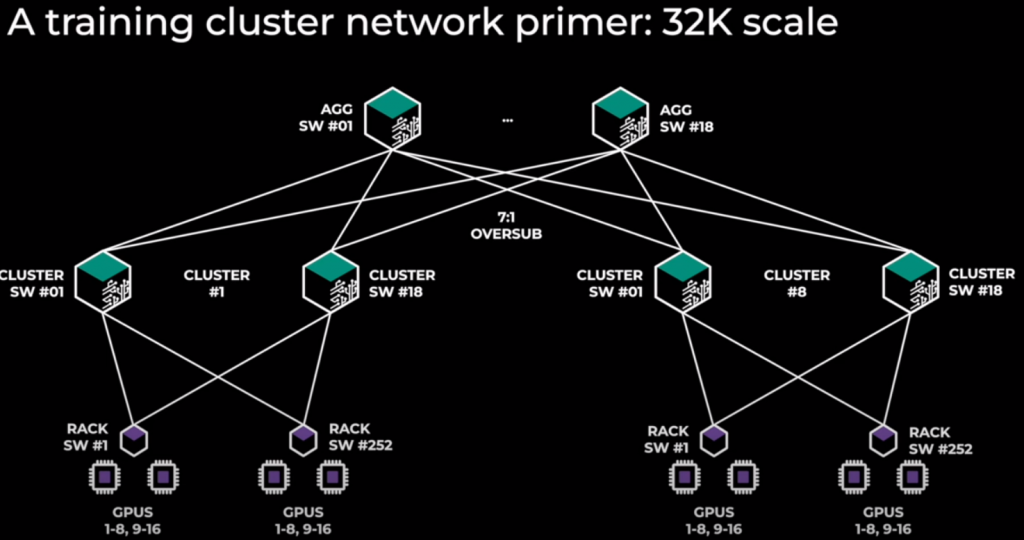
— Network scale-out: 48k nodes in a single subnet. You can connect subnets using IB router.
— QoS: achieve loss-less flows.
— Fabric resilience: Fast-ReRouting at switch level takes 1ms compared with 5s using Traffic Manager => Self-Healing
— Optimal load-balancing: using AR (adaptive routing). Rebalance packets and flows.
–MPI super performance (SHARP – scalable hierarchical aggregation and reduction protocol): off-load operations from cpu/gpu to switches -> decrease the retransmissions from end hosts -> less data sent. Dont really understand this.
— Variety of supported topologies: fat-tree, dragonfly+, torus, hypercurve and hyperx.
— Similar layers as OSI model: application, transport, network, link and physical.
— In IB, applications connect to NIC, bypass OS.
— Upper layer protocol:
— MPI: Message Passing Interface
— NCCL: NVIDIA Collective Communication Library
— iSEB: RDMA storage protocols.
— IPoIB: IP over IB
— Transport Layer: diff from tcp/ip, it creates an end-to-end virtual channel between applications (source and destination), bypassing OS in both ends.
— Network Layer: This is mainly at IB routers to connect IB subnets. Routers use GID as identifier for source and destinations.
— Link Layer: each node is identified by a LID (local ID), managed by the Subnet Manager. Switch has a forwarding table with “port vs LID” <- generated by Subnet Manager. You have flow-control for providing loss-less connections.
— Physical Layer: Support for copper (DAC) and optical (AOC) connectors.