I hit rock bottom this week. I hope I finally closed one door in my life so I give myself the chance to open others. Made the wrong decision? It is easy when you look back. Do I regret it? The most annoying thing is these are failures so you can’t go back and recover. But I was so bloody newbie!!!…. At least after 5 years…
“For every reason it’s not possible, there are hundreds of people who have faced the same circumstances and succeeded.” Jack Canfield
Head down, crying, cursing, whatever, but forwards. As it has always been.
—-
Somehow managed to list to long videos, something I normally can’t manage (because lack of time, etc)
Negative Beliefs, avoid bitterness, aim for greatness (remarkable things), scape the darkness: Jordan B Peterson with Modern Wisdom: video, podcast.
Find and keep Love: video. 1st Get your shit together. Communication is critical. Be careful with your shopping list….
Using gNOI capabilities to simplify software upgrade use case: video – I had to idea about gNOI so looks interesting. It is crazy that still in XXI, automating a network device is so painful. Thanks to all vendors to make your life miserable.
Go lang for network engineers: videoslides– I always thought that Golang had a massive potential for network automation but there was always lack of support and python is the king. So nice to see that Arista has things to offer.
There are more things, but havent had the chance to review them.
—-
It looks there is new chatbot that is not using the standard NVIDIA GPU. Groq uses LPU (Language Processing Unit). And they say it is better than a GPU. They have this paper but I can’t really see feature of that LPU.
Slurp’it: Show this blog, and the product looks interesting but although is free, it is not opensource and at the end of they you dont want a new vendor-lockin
Container lab in kubernetes: Clabernetes. I would like to play with this one day.
NetDev0x17: videos and sessions. link This is quite low details and most of the time beyond my knowledge. Again, something to take a look at some point.
LLM from scratch: repo. Looks very interesting. But the book it is going to take a long time to hit the market.
open standard: IBTA features: simple mgmt: each fabric has a SM: subnet manager
nodes and links discovery
local id assigment: LIDS
routing table calculations and deployment
configure nodes and ports ie: qos high bw: non-blocking, bi-dir. 4 physical lanes (max 12) EDR: 25G per lane / HRD: 50G per lane / NDR: 100G per lane cpu offload: kernel bypass, RDMA for CPU and GPU. low lat: 1micro for RDMA scale out/flex: up to 48k nodes in one subnet. Beyond that use IB routers/ qos: resilience: self healing. 1ms. LB: adaptive routing, dynamic load balancing sharp: mpi super performance: scalable hierarchical aggregation and reduction protocol. offload collective operations from host cpu/gpu. variety topologies: fat tree, torus 3d, dragonfly
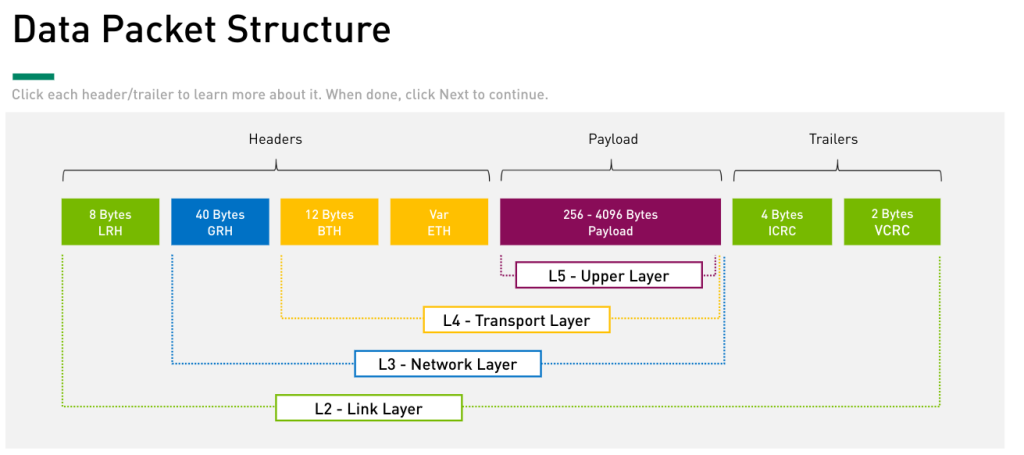
L5 Upper: Mgmt protocols: subnet mgmt and subnet svcs. Verbs to interact with Transport Layer L4 Transport: services to complete specified operation. Reassemble and split packets. L3 Network: describes the protocol for routing a packet between subnets L2 Link: describes the packet format and protocols for packet operation. (routing within a subenet) L1 Physical: framing and signaling
L2: LRH 8B + (L345) + Trailer (ICRC 4B + VCRC 2B) LRH: Local Route Header: local src and local dst port. Includes SL (Svc Level) and VL (?). VL is the only field that changes while the packet traverses the subnet. ICRC: Invariant CRC // VCRC: Variant CRC L3: GRH 40B + L45 GRH: Global Route Header: present in packet that traverses multiple subnets. Routers forward packet based on GRH. Router recalculate VCRF but not ICRC. L4: BTH 23B + ETH var + L5 BTH: Base Transport Header: operation code (first, last, intermediate or only packet + operattion type: send, rdma wr, read, atomic), seq num (PSN) and partition. ETH: Extended Transport Header: conditionally present depending on CoS and operation code. L5: Payload 256-4096B
Wireshark: (L3 only in packet that need to be routed to a different subnet.) Local Route Header -> L2 Base Transport -> L4 DETH – Datagram Ext Transport Header -> L4 MAD Header – Common mgmt datagram -> L5 SMP (Directed Route) -> L5 ICRC – L2 VCRC – L2
Mgmt
fabric: link, switches and routers than connect channel adaptor subnet: port and links with comom subnet id and managed by same SM. -router connects subnets
SM: subnet manager. Centralized routing mgmt. plug and play. One master SM, the rest standy.
discovering topology
assigning local ids to nodes (LIDs)
calculate and program switching forwarding tables
managin elements
monitoring elements Impleted in a server, switch or specialized device.
elements: Manager: active entity Node: managed entity: switch, HCA, router Agent: each node has a SMA (subnet manager agent). Passive, responds to Manager. Can send traps
MADs: standard message format betwen Agent and Manager
Addressing: L1: GUID: Global Unique Id: unique address burned by vendor in hw: chassis, HCAs, switches, routers and ports. L2: LID: Local Id: Assigned by SM. Unique within the subnet. Src and Dst LIDs are present in LRH. Dst LID is used by switch to send packet. L3: GID: Global Id: identify end port or multicast group. Unique across subnets. Src and dst GID are in GRH. Dst GID is used by router.
OFED Monitoring Utilities
OpenFabrics Entreprise Distribution (OFED): sw stack for RDMA and kernel bypass apps. OFED utilities facilitate control, mgmt and diagnosis of IB fabrics.
verify OFED installation: $ ofed_info | head -1 verify OFED running: $ /etc/init.d/openibd status verify HCA (nic) installe: $ lscpi | grep -i mellanox verify IB running: $ ibstat -> list all local HCAs. info from IB driver. GUID, LID, por state, rate verify connectivity: ibping (verify connectiity between hosts). It is Client-Servre command destination: # ibping -S (server mode) source: # ibping -L verify path: ibtracert: source LID to dst LID. # ibtracert ===> You dont have to run the command from the source LID itself !!!
3) Physical Layer
Overview
functions: bit sync, bit rate control, phy topologies, transmission mode specifications: start, end delimeter, data symbos
HCAs = Host Channel Adapter = NICs
connect server to switch. NIC + offload. 1 or 2 ports. GUID = MAC
Media Types and Interconnection
link width: 1,4,8,16 lanes. Current usage: only 4 link rate: link speed * link width DAC ACO EDR: Enhanced Data Rate – 25G per lane = 100G 5m 100m HDR: High DR – 50G per lane = 200G 2m 100m NDR: Next DR – 100g per lane = 400G 4m XDR: Extreme DR – 200G per lane = 800G
DAC: direct attach – copper cable AOC: active optical cable: each line: 1xtx 1xrx – total 8 (more expensive than DAC). MultiMode (3-100m)
Responsabilities
establlish physical link, monitor status, inform link layer, guaranteeing signal integrity for best Bit Error Rate (BER)
status: polling (not cable connected), disabled, portConfigTraining, LinkUp, LinkError Recovery (cable is faulty) # ibstat => show you status of hca
BER = number bit errors / total number bit transferred
Addressing
GUID: (like MAC) Globally Unique Id = 65 bit (assigned by vendor)
system GUID: abstract several GUID in one (like a cluster of devices)
Node GUID: HCA, switches or routers
Port GUID: HCA port.
HCA has: 1x System GUID, 1x Node GUID, 1x Port GUID per physical port –> # ibstat
Switch (Fixed): 1xASIC (1xNode GUID), 1xSystem GUID. It doesnt have Port GUID
Director (Modular) switch: 1xSystem GUID, each module has 1xNode GUI
OFED
# ibportstate -> state, speed, lanes, etc

# ibswitches -> list switches in the subnet and GUIDs

# ibhosts: list all HCAs in the subnet and GUIDs

# ibnodes: list both HCAs and switches in subnet.
4) Link Layer
switching inside local subnet
Link Layer Services
Packet Mgmt: Link mgmt packets data packets: send, read, write, ack header= LRH 8B + GRH 40B + BTH 12B + ETH var payload= 256-4096B ICRC 4B + VCRC 2B
L2 Addressing routing inside local subnet. Each node has LID (local ID) 2B inside LRH LID assigned by Subet Manager when initilization and when topology changes. HCAs: LID per port Fix form switch: 1 LID Modular switches: 1 LID per module Each subnet max 48k unicast LID 16k multicast LID
QoS enabled prioritization app/users/data flows. Service Levels (SL) and Virtaul Lanes (VL) SL is in LRH: defines class of packet VL is in LRH: implements multiple logical flows over a single physical link different packets are mapped to different VLs based on SL (marking) each VL has a weight and priority each VL uses different buffers each VL has a scheduler Max 16 VL: special VL: VL15: Subnet Manager traffic only VL0: all data traffic VL1-14: free to use to implement your QoS policy
Packet Forwarding LID is read by switch to route to destination, checking the LFT (Linear Forwarding Table: table of LDID -> Exit Port) Implementing QoS: LFT contains SL to VL mappings # ibswitches -> list of switches with LID # ibroute –> shows LFT of switch with LID 10 // OutPort=000 means the packet is processed by switch.
Flow Control Lossless Fabric. Flow Control: prevents fast sender to overwhelm slow receiver to avoid drops and retransmissions. Credit based FC: receiver sends credit to sender to indicate availability of receive buffers. Sender waits for credits before transmissing. packet are not held forever. There is timeout, if expires, packet is dropped. Each VL can have a separate FC.
Data Integriy by CRC: Cyclic Redundancy Check. Hash function. If calculation of CRC doesnt match, packet is dropped and request resend. end-to-end integrity ICRC: invariant – all field that dont change 32bit VCRC: variant – whole packet. 16bit
OFED
# iblinkinfo: all nodes in fabric: LID, GUID, hostname, link speeds

# ibnetdisconer: fabric discovery and list all ndoes: LID, GUID, hostnames and link speeds. Generates a file with topology
5) Network Layer
routing solution overview
connect different subnets (each max 48k nodes)
routing benefits: -scaling -isolation: separation, fault resilience, reliability, availability -subnet management per each subnet -connectivity: each subnet can have different topology
network layer overview
handles routing of packets between subnets using GID in GRH 40B (Global Routing Header) unicast and multicast GID: Global ID – 128 bit — identifies single port or multicast group: GID= 64bit subnet prefix + port GUID (kindoff ipv6) globally unique across subnets
each HCA port has an automatic assigned default GID (fe80::) that can be used only in local subnet (kindoff ipv6 link-local)
OFED
# ibv_devices -> ib devices installed in server (hcas)
# ibaddr -> displays GID and LID
6) Transport Layer
overview
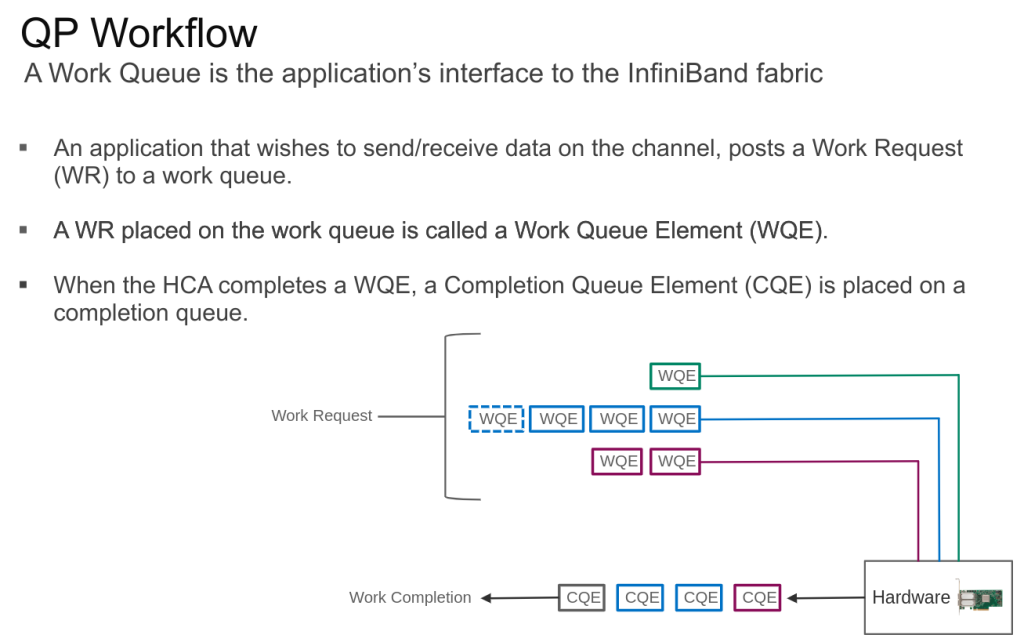
end-2-end communication services for apps – virtual channel. segment/reassembly channel end-point are called Queue Paros (QPs): Each QP represents one end of a channel. QP bypass kernel during data transfer. HCA oversees reliability QP has a send and receive queue. QP id is 24 bits. apps have direct access to hw: mapping app’s virtual address into the QP. If an app required more than 1 connection -> more QPs are created QP workflow: A work queue is the app’s interface to the IB fabric. If app wants to send/receive data -> post a Work Request (WR) to a work queue (that is a WQE – WQ Element) When the HCA completes a WQE, a completion queue element (CQE) is placed on a completion queue.
Responsibilities: Three below
segmentation/reassembly
segment when message bigger than MTU, done by HCA. HCA receiver side reassembles. payload: 256-4096 bytes default mtu = 4096
transport modes
QP has 4 transport service types. Source/Destination QPs must have same mode. Service type depends on app. RC: reliable connection UC: unreliable connection RD: reliable datagram UD: unreliable datagra
connected: dedicated QP for one connection in eachc end. Higher performance than datagra but more kernel memory consumed. Most used. Segmentation is supported datagram: single QP servers multiple connections. Segmentation is not suppoerted. More scalable that connected (similar to multicast) reliable: each packet has Packet Seq Num (PSN). Receiver send Acks if packet arrive in order, send negativa ack otherwise. Send QP has a timer. Similar to TCP. unrelible: no ack.
partitions
divide large cluster into small isolated subclusters -> multitenancy, multi apps, security, qos. ports maybe members of multiple partitions at once port in different partitions are unaware of eachc other.
PKEY: partition id. 16bit in BTH header. Carried in packets and stored in HCA. Used to determine partition membership. The Subnet Manager SM assings the PKEY to the ports.
membership type: limited vs full limited: can’t accept other limited membership in the partition. all nodes may communite with SM. Full<>Limited is always oke (with same PKEY) IE: storage, network mgmt. default PKEY is 0x7fff. everything is part of that pkey and assigned by SM. And all are full. 65535
high-order bit (left most) in PKEY records the type membership: 0 = limited / 1= full -> 0x7fff = 111 1111 1111 1111
offloading
RDMA: remote direct memory access. data read/write to remote server bypassing CPU in both ends. zero buffer copy. reduce latency, increase throughput, cpu freed up
two methos for offloading: -channel semantic: send/receive. Sending app has no visibility on receivers buffer or data structure. Just send data. Syncronoues data flow -memory semantic: rdma read/write rdma write example receivedr side, register a buffer in its memory space and pass it to the sender. Sender uses RDMA send/write. Async communication. sender sides does the same. send side puts a WQE. its hca generates CQE. The receiver HCA puts the data directly in the memory, there is no WQE/CQE in receiver side.
ofed
perftest: read/write and send tests. client-server. cpu same in client and server.
latency perf test (-h)
 server        client
  ib_read_lat  ib_read_lat
  ib_write_lat ib_write_lat
  ib_send_lat  ib_send_lat

bw perf test (-h)
 server       client
  ib_read_bw  ib_read_bw
  ib_write_bw ib_write_bw
  ib_send_bw  ib_send_bw
7) Upper Layer
overview
support upper layer protocols (Native IB RDMA, IPoIB,etc). mgmt svc protocls (Subnet mgmt and subnet services). sw transport verbs to communicate with HCA/IB fabric (clients of upper layer)
upper layer protocols: MPI (for HPC), IPoIB (enables TCP/IP over IB), SDP (high perf interface for standar socket apps – TCP), SRP (SCSI devices over RDMA), iSER (zero copy RDMA to eliminate TCP and iSCSI bottleneck, better than SRP), NFS RDMA (NFS over RDMA)
management service protocols
-subnet mmgnt: Uses special mgmt datagram (MAD) class called SMP: subnet mgmt packet -> uses special QP0, always uses VL15 and not subject to flow control. -general services: Used MAD called GMP: General mgmt Packet. Each port has a QP1 and all GMPs are received on QP1 are processed by one GSA (General Service Agent). GMP uses any VL except 15 (default 0), subject to Flow Control
sw transport verbs
verb: describe actions how an app request acctions from the messaging svc. ie RMDA send: rdma_post_send, rdma_post_recv RDMA write: rdma_post_write RDMA read: rdma_post_read OpenFabrcAlliance: defines verbs specification.
— Fabric Mgmt —
8) Fabric Init
Init Stages
subnet has a common Subnet ID. Router connects subnets. Each subnet has SM (discovery topo, assign LIDs to nodes, calculate/program forwarding tables, manage all elements, monitor changes). SM can be a server, switch or special device. Each node has a SMA (SM Agent) that communicates with SM
1 Phy Fabric Establish: connect all cables
2 Subnet Discovery: Once SM wakes up, starts discovery with direcltly connected nodes, and then their neigbors. SM gathers switch info, port info and host info. SM uses SMPs (SM packets)
3 Info gathering: SMPs uses VL 15. Two types: -Directed-routed: forwarded based on a vector of port numbers. Not dependent of routing table entries. Provide means to communicate before switches and hosts are configured (before LIDs are assigned). Mainly for discovery. Only SMI (SM interface) allows for these packets. Two types of messages: — get: SM polls fabric with get. — get response: answer from devices. Two types of commands: — get node / port info: — get response node / port info: -LID-routed: forwards using switch forwarding table (after SM populates them)
topo info gather: switches, hcas, ports, links. Topo described by nodes GUID and port numbers. node info gather: type, number ports, GUID, description port info gather: MTU, VLs, width (num lanes), speed.
4 LIDs Assigment: SM assigns LDIS to nodes HCA: 1 LID per port 1RU switches (1 ASIC): 1 LID for whole switch Modular switch: 1 LID per module (linecard)
5 Paths Establishments min-hop: calculate number of hops required by eachc port to reach each destination LID. Shortest is best. tie-breaker: port with fewer LIDs assigned.
6 Port Config LID (unique in subnet), width (number of physical lines), MTU (default 4096), speed. QoS: VLs, SL to VL (mapping table Service Level to VL), VL arbitration
7 Switch Config SM populates the switch’s LFT with the best routes. LFT: destination LIDs -> exit port. And SL-VL table.
8 Subnet Activation IB port: physical states: polling (after power on, cable not connected), training (establish link sync), linkup (ready to transfer packets) logical states: down (phy is down: polling or training), init (phy is up but only deals with SMP and flow control), armed (verify data transfer fine. SM sends dummy SMP with VCRC to verify that is not corrupted), active (SM send active to port)
ofed
# ibswitches: GUID, description, ports and LID.
# ibroute <switch_LID>
9) Fabric monitoring
SM properties
election process master SM: recommended (2xSM, master , standby) Each has priority: 4 bit: default=0, highest=15. tie-breaker: lowest GUID SMInfo attribure used by SM to exchange info during subnet discovery and polling: GUID of the port of SM, priority and SM state (master, standby)
SM failover / handover
SM Failover: Master SM fails. Running sessions are not affected. New sessions need to wait for new master. By default, LIDs are not reassinged by new master. SM Handover: new SM with hight priority takes over master role. -avoid double failover: 1) avoid handover. 2) master_sm_priority=15 for all SM (and hight than current priority)
Monitoring
light sweep: each 10s. SM interrogates nodes and port info from all switches: Port status changes, new SM appears, standby SM changes priority A change traced by light sweep, causes heavy sweep.
heavy sweep: light sweep detects change or SM receives IB trap. -> SM triggres fabric discovery from scratch: topo discovery, new LIDs (if necessary), program fw tables!. current flows through not affected path, are not affected by rediscovery.
host down or leaf switch down -> avoid heavy sweep (not need to recalculate all fw tables in nodes) -> SM configuration: Ucast-cache=True
ofed
# sminfo -> master SM: LID, GUID, priority and state
# smpquery nd -> identify whitch node is running the SM
# saquery -s -> query all SMs (master and standby)
10) IB topologies part1
concepts
network topology: schematic arrangement of network elements: links, nodes phy topology: how devices are connected logical topo: how data moves from one node to another considerations;
future growth: add new nodes without affecting performance or user experience
budget: effective and affordable
leaf-spine.
predictable and deterministic latency
scalability
redundancy
increase bw
topologies:
fat-tree
tree like topology where links nearer the top of the hierarchy are “fatter” = having more links/bw, than links further down. thickness = bandwidth It is about oversubscription ratio: downlinks / uplinks => 1:1 (non-blocking)
non-blocking: oversubscription 1;1 in all levels, higher cost. (real fat-tree are often oversubscribed) blocking: oversubscription 2:1,3:1,3:2, reduced cost, not full bw, low latency is maintained.
summary: good for hpc, non-blocking or oversubscription, lowest/deterministic latency (2levels->3hops, 3levels->5hops)
dragonfly+ (BGP confederation)
connect groups in full-mesh, inside group leaf-spine. requires adaptive routing.
summary: support large number hosts, extending fabric without reserving ports (fat-tree requires recabling), lowlat and high bw: flexible and cost reduction
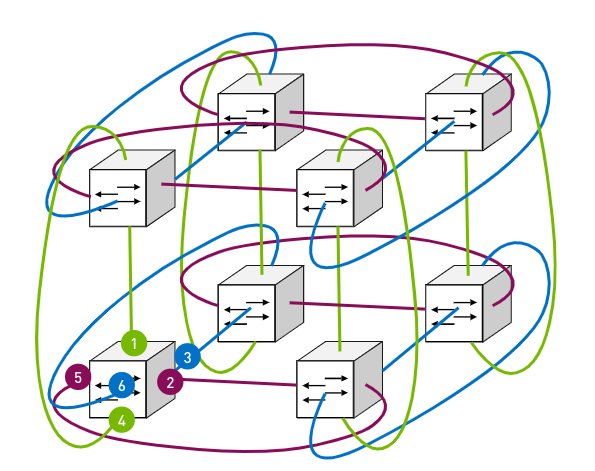
torus 3d
nodes connected in a ring formation in 3D (x,y,z) eachc node has 2 links in each ring (3rings=3D)=6 links to neighbor switches very scalable and resilient:
summary: good for locality, cabling simpler/shorted (less cost: effective, power, resilient), main benefit: cost -> good for very large installs. Hight fault tolerant.
adaptive routing (AR)
load balancing between same best cost paths (min-hop) and installs in FIB. For every connection the switch will dynamically choose the least congested port. Reduces contention.
credit loops
IB uses credit-based flow-control to avoid packet loss in congested switches: a sending port can send packets if it is granted with credits from receiving port credit loop: cyclic buffer dependency (buffers are full) (some cases you have to reboot a switch to fix!) They can create a deadlock (rarely) avoid credit loops: UpDown routing algo: prevents traffic forwarding from downstream link to an upstream. Forbidden: down -> ups allowed paths: up, down, up -> down, same level (up-up, down-down)
10) IB topologies part2
routing engines: way paths are choosing = routing protocol. Each RE uses its own algo according to topology
min-hop: topo agnostic. default algo. 2 stages: 1) compute min-hop table on each switch 2) LFT output port assigment in eachc switch. doesnt prevent credit loops.
up-down (+AR): fat-tree topo prevent deadlocks (min-hop can’t) algo: 1) starts with root switches (rank 0). 2) Find all switches 1 hop away fro root -> rank 1 3) Switches 2 hops away from root -> rank 2 4) so on 5) Find shortest path between every pair of endpointns 6) Any path that goes down (away from root) and then up (toward root) is discarded => rank N -> rank N+1 (up) -> rank N (down) avoid credit loops: forbidden paths go down (away from root) and then up (towards root)
fat-tree (+AR): fat-tree topo. fully-symmetrical fat-tree has its leaf switches connected with the same port index to each spine. Avoid credit loop like UpDown algo (forbidden paths down-up). Can do load-balancing to avoid congestion
torus 2-QoS: torus-2/3d topo. Free of credit loops, two levels of QoS. Self-heal (single failed switch, and/or multiple failed links) -> rerouting automatic by SM. Short run time, good scaling
dragonfly+ AR: dragonfly topo. Achieving max bw for different traffic patterns requires non-min multi-path routing => use min-hop+1 routes. You use min-hop+1 based egress queue load (so you avoid congestion just following a longer path) Trinagule example. Credit loops prevention: -path with down->up can potentially cause a credit loop. -credit-based flow-control operates per VL: Buffers are allocated per VL. Received credits are granted per virtual lanes. -DragonFly+ uses VL increment to avoid credit loops: The VL value is incremented when packet is forwarded from down->.up direction. 2 VLs are enough to prevent credit loops.
drangonfly connects “groups”
configure updn routing engine /etc/opensm/opensm.conf -> default location – SM params opensm -c /etc/opensm/opensm.conf -> creates default SM config. For UpDown: provide the roots GUID list -> # ibswitches -> create list in /etc/opensm/root_guid.conf -> update opensm.conf with: root_guid_file /etc/opensm/root_guid.conf Update opensm.conf with routeing engine: routing_engine updn // or use # opensm -R updn restart opensm: # service opensmd restart check logs: grep table /var/log/opensm.log
— IB fabric bring up —
11) IB driver installation
what is OFED?: OpenFabric Enterprise Distribution: opens source sw for RDMA and kernel-bypass apps. nvidia-ofed: supports IB and ethernet. up to 400G. linux/windows/VMs.
install ofed linux: hw requirements: 1GB space, supported linux, admin priv prepare install: ofed_info -s (current version). For new install: kernel + os -> uname -a / cat /etc/os-release hca installed: lspci -v | grep -i mellanox download driver from nvidia site. mount image, install : # mount -o ro,loop MLNX_OFED_FILE.iso /mnt cd /mnt && sudo ./mlnxofedinstall restart: # /etc/init.d/openibd restart verify: ofed_info | head -1 –> verify new version installed ibstart –> verify HCA is discovered as IB node
12) HCA firmware upgrade
hca hw and tools overview: host-channel-adapter. If you install ofed, upgrade hca too. You can upgrade hca itself. MTF tools: MST: NVIDIA software tools serice. Flint: firmware burning tool. MLXfwreset: loading firmware on 5th gen devices tool
firmware upgrade steps: hca type: lspci | grep -i mellanox hca info: ibv_devinfo -> hca_id, fw_ver, vendor_part, board_id (PSID) download firmware: seach card type and then check every OPN option until you find a PSID that matches board_id (above command) unzip + burn: 1) find hca full path: # mst status (or start it: mst start)-> search for /dev/mst/…. 2) # flint -d /dev/mst/xxxxxx -i FIRMWARE.bin b /// b = burn !!! reset: # mlxfwreset -d CARD reset $ ibstat -> compare fw version changed
13) Running the SM
SM on a server, switch or NVIDIA UFM. Considere fabric scale (number of nodes): Init fabric, calculate fw tables, conf nodes and monitor changes. Licensing cost. enhanced features
switch: inband or outband mgmt: mgmt in-band by SM, MLNX-OS has embedded SM. Unmanaged dont have SM. SM for small fabrics (up 2048 nodes). Not support AR and dragonfly. No additional license. enable sm:
enable # conf t # show ib sm disable # ib sm # show ib sm enable configure sm: # ib sm sm-priority 14 # show ib sm sm-priority # ib sm ? ==> options # ip sm routing-engine ? => change routing engine from min-hop (default)!
server: large-medium fabrics. open-sm included in mlnx-ofed. no license. support AR and dragonfly run opensm # opensm -h or run as a demon # /etc/init.d/opensmd start /etc/init.d/opensmd status logging: /var/log/messages (general) + /var/log/opensm.log (details errors) config: opensm -c /etc/opensm/opensm.conf -> creates default config file routing engine config, list, tries one by one until success: routing_engine ar_updn (nov 2021 default RE is updn with AR)
UFM (Unified Fabric Manager): WebUI solution: telemetry, analytics, etc. Uses OpenSM. Can run on a server as a service, docker or dedicated hw. telemetry, enterprise (telemetry + enhanced monitoring and mgmt), cyber-ai (telmetry + enterprise + security) enterprise: licensed per managed device. WebUI: settings -> subnet manager, setting -> network management: routing engine
— IB monitoring —
14) IB diagnostics
node-level ofed_info: mlnx_ofed driver version lspci: find hca ibstat: link status ibportstate LID PORT ibroute LID: routing table of switch LID ibv_devices: list hcas ibv_devinfo: list hcas details
fabric-level: ibswitches: list switches ibhosts: list hcas ibnodes: list all nodes ibnetdiscover: show node-to-node connectivity iblinkinfo: list all nodes and connectivity info sminfo: show master sm ipbing ibtracert SLID DLID ibdiagnet ib_write_lat ib_read_lat ib_write_bw ib_read_bw
ibdiagnet: fabric disconery, error detection and diagnostics. part of ibutils2 package. part of mlnx_ofed and ufm. fabric discovery, duplicated GUIDs, duplicated nodes descriptions, LIDs checks, links in INIT state, counters, error counters check, routing checks, link width and speed checks, topology matching, partition checks and BER test.
Discord Scale: I think I read something about Elixir (and BEAM). So It was nice to side a successful product built with it. And how Discord has managed to keep pushing the scale of their platform. Everything is high level but gives you an idea.
HotChips 2023: I received an email with all presentations and videos. Some picked my curiosity (although ALL of them are out of my understanding
Exciting Directions for ML Models and the Implications for Computing Hardware: video and pdf. A lot of focus in power consumption and reduce CO2. The optical I am still struggling. But it is interesting that they say they go for liquid cooling and beyond Ethernet for the supercomputer.
Inside the Cerebras Wafer-Scale Cluster: video and pdf. I have read about Cerebras before so it was nice to read/see something directly from them.
They made Google Huge: based on link. From the google presentation above, and the end there are a lot of references about the authors. I think I read about it in the past but It was nice to re-read it again.
BIND: Interesting links about BIND performance and the lab setup. DNS is the typical technology that looks straightforward but as soon as you dig a bit, it is a world itself
LACP: Interesting blog about troubleshooting details. As above, this is the typical tech that you give for granted that works but then, you need to really understand how it works to troubleshoot it. So I learned a bit (although the blog is “old”)
Chiplets: Very good blog. Explaining the origin of getting to chiplets. Interesting evolution and good touch to mention the network industry, and not just CPU/GPU.
As the process node shrank, manufacturing became more complex and expensive, leading to a higher cost per square millimeter of silicon. Die cost does not scale linearly with die area. The cost of the die more than doubles with doubling the die area due to reduced yields (number of good dies in a wafer).
Instead of packing more cores inside a large die, it may be more economical to develop medium-sized CPU cores and connect them inside the package to get higher core density at the package level. These packages with more than one logic die inside are called multi-chip modules (MCMs). The dies inside the multi-chip modules are often referred to as chiplets.
AI/HPC Networking: Nice summery about AI vs HPC, and what each hyperscaler and vendors are doing. For me is quite interesting how to get proper loadbalacing of flows like AWS SDR. This should be an actual standard by any network vendor or software to aim to that goal. I guess it is not easy.
High performance requirements can create a vendor lock-in. Doesn’t matter if it is IB or Ethernet. So pick your evil.
Spray ML/AI worloads: Based on the above regarding the loadbalacing, this is an interesting article about how to generate loadbalancing in ML workloads when it is based in just one elephant flow. So you need Adaptive routing in your fabric/switches, NICs that support it and support from your code/library.
AWS Reinvent Intent-Driven Network Infra: Interesting video about Intent-driven networking in AWS. This is the paper he shows in the presentation. Same note as last year, leaf-spine, pizza boxes, all home made. The development of the SIDR as the control plane for scale. And somehow the talk about UltraCluster for AI (20k+ GPU). Maybe that is related to this collaboration NVIDIA-AWS. Interesting that there is no mention to QoS, he said no oversubscription. In general, everything is high level, and done in-house, and very likely they facing problems that very few companies in the world are facing. Still would be nice to open all those techs (like Google has done – but never for network infra). As well, I think he hits the nail on the head how he defines himself from Network Engineer to Technologist, as at the end of the day, you touch all topics.
Google view after 18 years: Very nice read about the culture shift in the company, from do not evil, to make lots of many at any cost.
GTP-Crawler: Negative thing, you need the pay version of chatgpt. I wonder, If I crawke cisco, juniper and arista, what would be nearly all network knowledge in the planet? If that crawler can get ALL that date.
VimGTP: Very interesting project. I haven’t used it. But thinking aloud, you could use it to interact with sites that dont have API (couriers)? I think with Selenium you can do things like that?
Maia AI: CLoud providers like to be masters of their own destiny so try to build as many things by themselves as possible. So now MS has developed its GPU for AI. It is quite interesting the custom rack they had to built with the sidekick for cooling down the new chips. There are no many figures about the chip (5nm, 105b transistors) to compare with other things in the market.
Reptar: new Intel CPU vulnerability. It looks like is a feature from Ice Lake architecture. It looks like you can crash the cores but no yet take over. Still interesting.
I am not affected 🙂
$ grep fsrm /proc/cpuinfo
$
Mellanox with Debian: Interesting how you can install a nearly standard Debian into a Mellanox SN2700 switch.
RISC-V into datacenter: Happy to see RISC-V chips in the datacenter. But not clear who is going to use them?
Mirai history: I think most of wired articles read like a holywood movie 🙂 Although 2016 security issues are “old” school, still interesting how teenagers got that far.
Mojo: Interesting because of the people behind of it… really impressive.
Moor’s law analysis: I liked the part about networks, that is not very common mentioned in these type of analysis.
Vendor Support API: Interesting how Telstra uses Juniper TAC API to handle power supplies replacement. I was surprised that they are able to get the RMA and just try to replace it. If they dont need it, they send it back… That saves time to Telstra for sure. The problem I can see here is when you need to open ticket for inbound/outbound deliveries in the datacenters, that dont have any API at all. If datacenters and big courier companies had API as 1st class citizends, incredible things could happens. Still just being able to have zero-touch replacement for power supplies is a start.
No Packet Behind – AWS: I think until pass the first 30 minutes, there is nothing new that hasnt been published in other NOG meeting between 2022 and 2023. At least the mention the name of the latest fabric, Final Cat. As well, they mention issues with IPv6 deployment.
There are other interesting talks but without video so the pdf only doesnt really give me much (like the AWS live premium talk)